Fig. 4
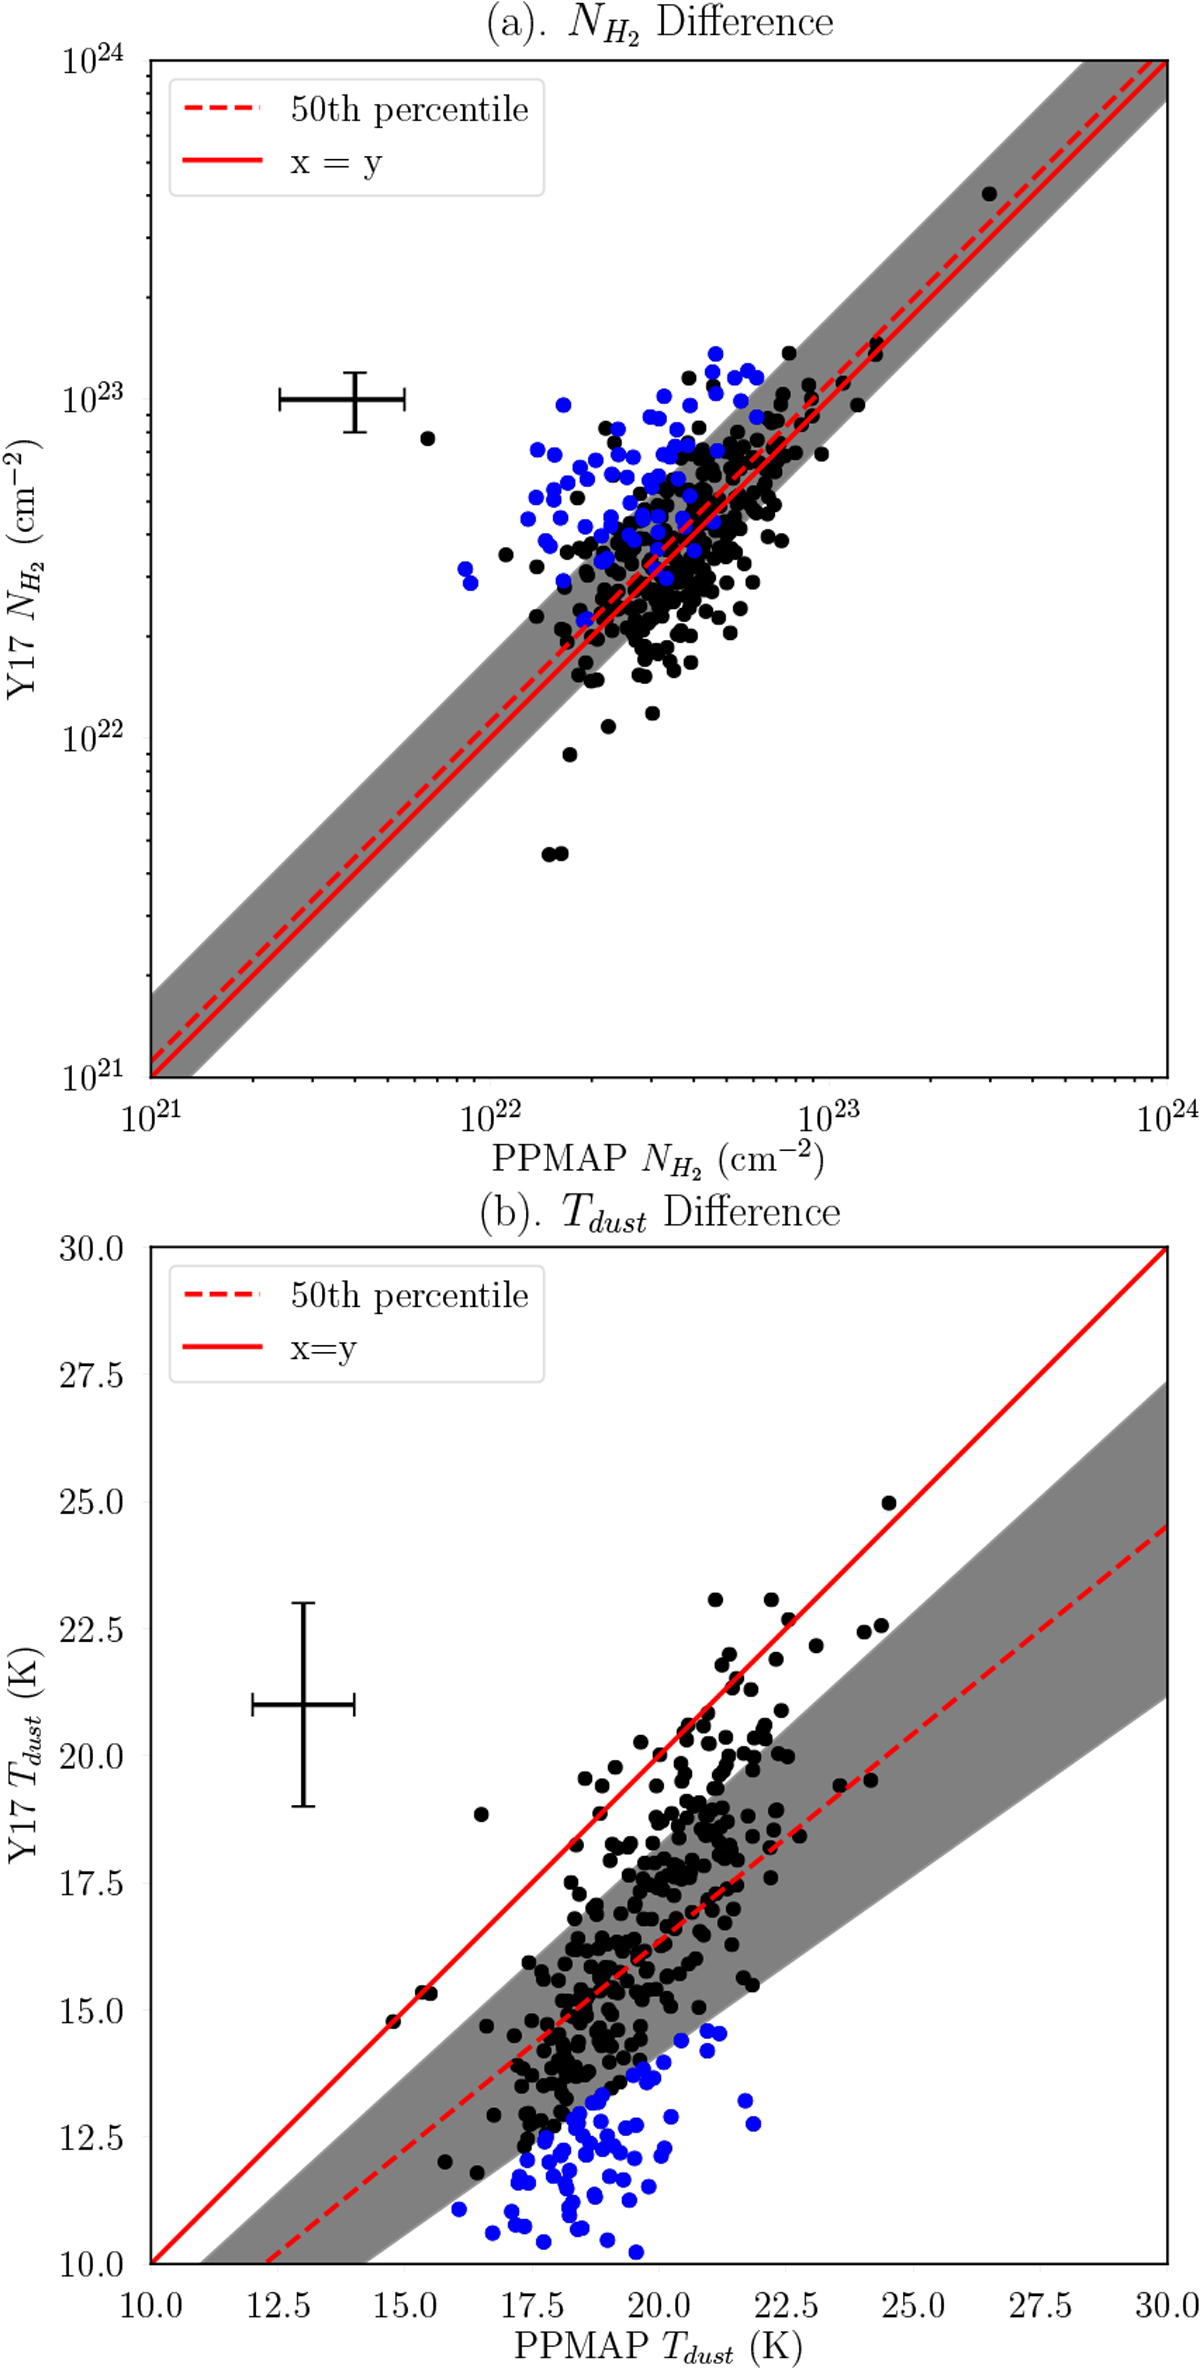
HMSCs ![]() and Tdust
derived from PPMAP Hi-GAL data and those in Y17. The red solid lines show 1:1 relations. The red dashed lines show the 50th percentile of the ratios of Y17 derived parameters to PPMAP Hi-GAL derived parameters. The gray regions show the 20th percentile to 80th percentile of the ratios of Y17’s parameters to PPMAP parameters. The blue points are sources with the lowest
Tdust and the largest difference of Tdust
between Y17 and PPMAP.
and Tdust
derived from PPMAP Hi-GAL data and those in Y17. The red solid lines show 1:1 relations. The red dashed lines show the 50th percentile of the ratios of Y17 derived parameters to PPMAP Hi-GAL derived parameters. The gray regions show the 20th percentile to 80th percentile of the ratios of Y17’s parameters to PPMAP parameters. The blue points are sources with the lowest
Tdust and the largest difference of Tdust
between Y17 and PPMAP.
Current usage metrics show cumulative count of Article Views (full-text article views including HTML views, PDF and ePub downloads, according to the available data) and Abstracts Views on Vision4Press platform.
Data correspond to usage on the plateform after 2015. The current usage metrics is available 48-96 hours after online publication and is updated daily on week days.
Initial download of the metrics may take a while.