Fig. D.1
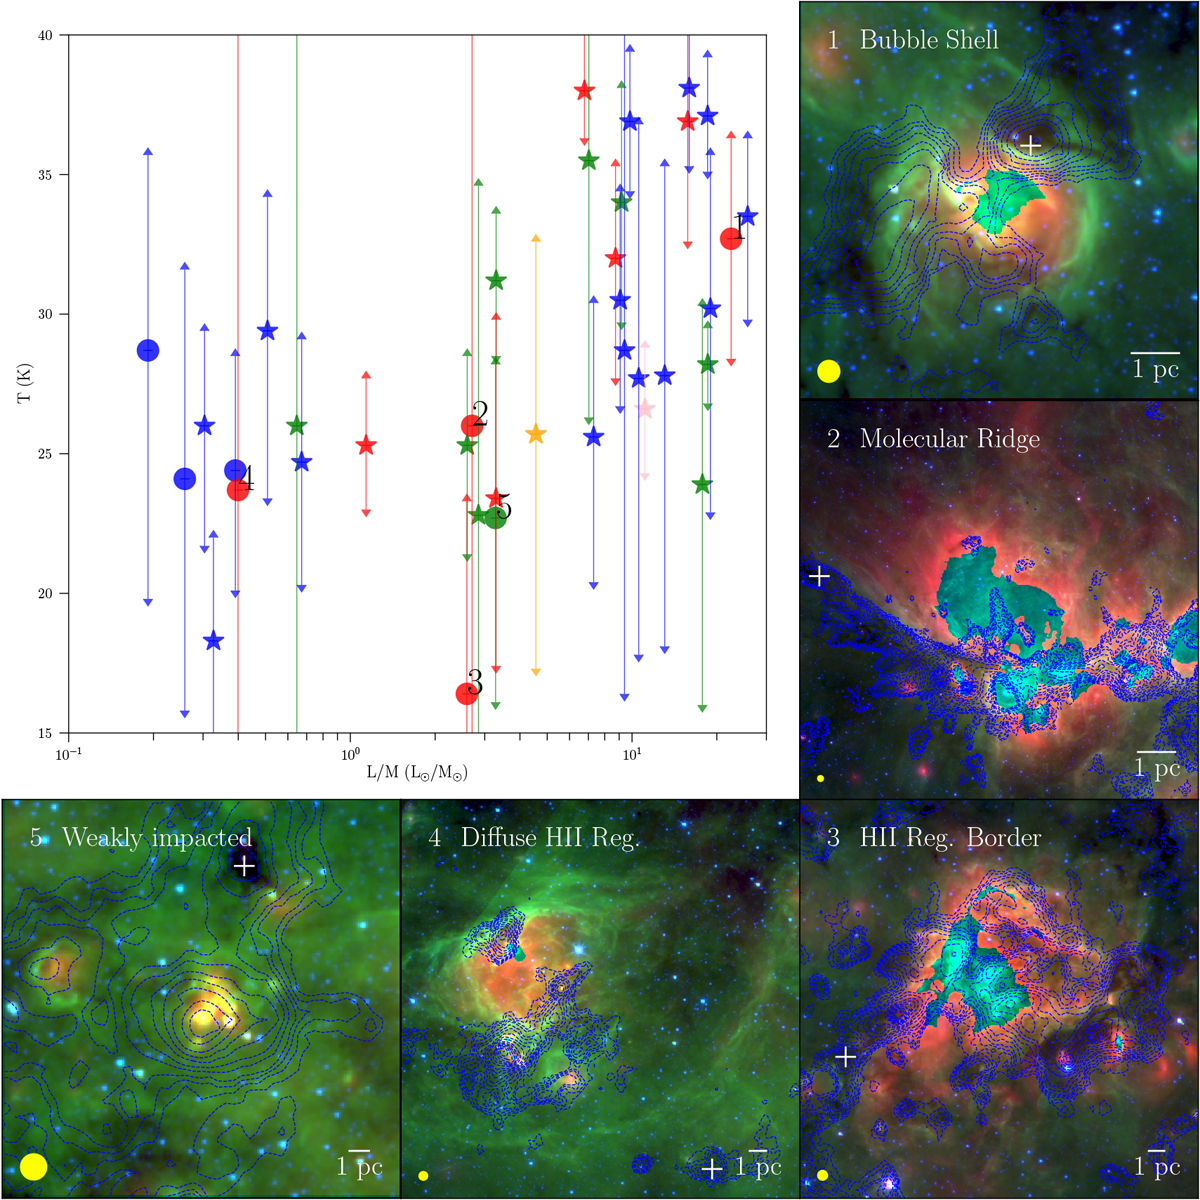
CH3C2H temperature, L∕M ratio, and environments. Top left plot: L∕M and CH3C2H gas temperature of massive clumps. The dots and stars represent the 70 μm weak clumps and IR weak clumps, respectively. The red, green, pink, orange, and blue labels represent S-type associated, O-type associated, S-type possibly associated, O-type possibly associated, and nonassociated clumps, respectively. L∕M ratio, CH3C2H temperature and its upper and lower limits are taken from Giannetti et al. (2017). Other plots: environments of all 70 μm weak clumps associated (or possibly associated) with H II region by Spitzer RGB images (constructed in the same methods as Fig. 1). The contours and yellow dots in the bottom left of the figures show the ATLASGAL 870 μm continuum and its resolution.
Current usage metrics show cumulative count of Article Views (full-text article views including HTML views, PDF and ePub downloads, according to the available data) and Abstracts Views on Vision4Press platform.
Data correspond to usage on the plateform after 2015. The current usage metrics is available 48-96 hours after online publication and is updated daily on week days.
Initial download of the metrics may take a while.