Fig. 3
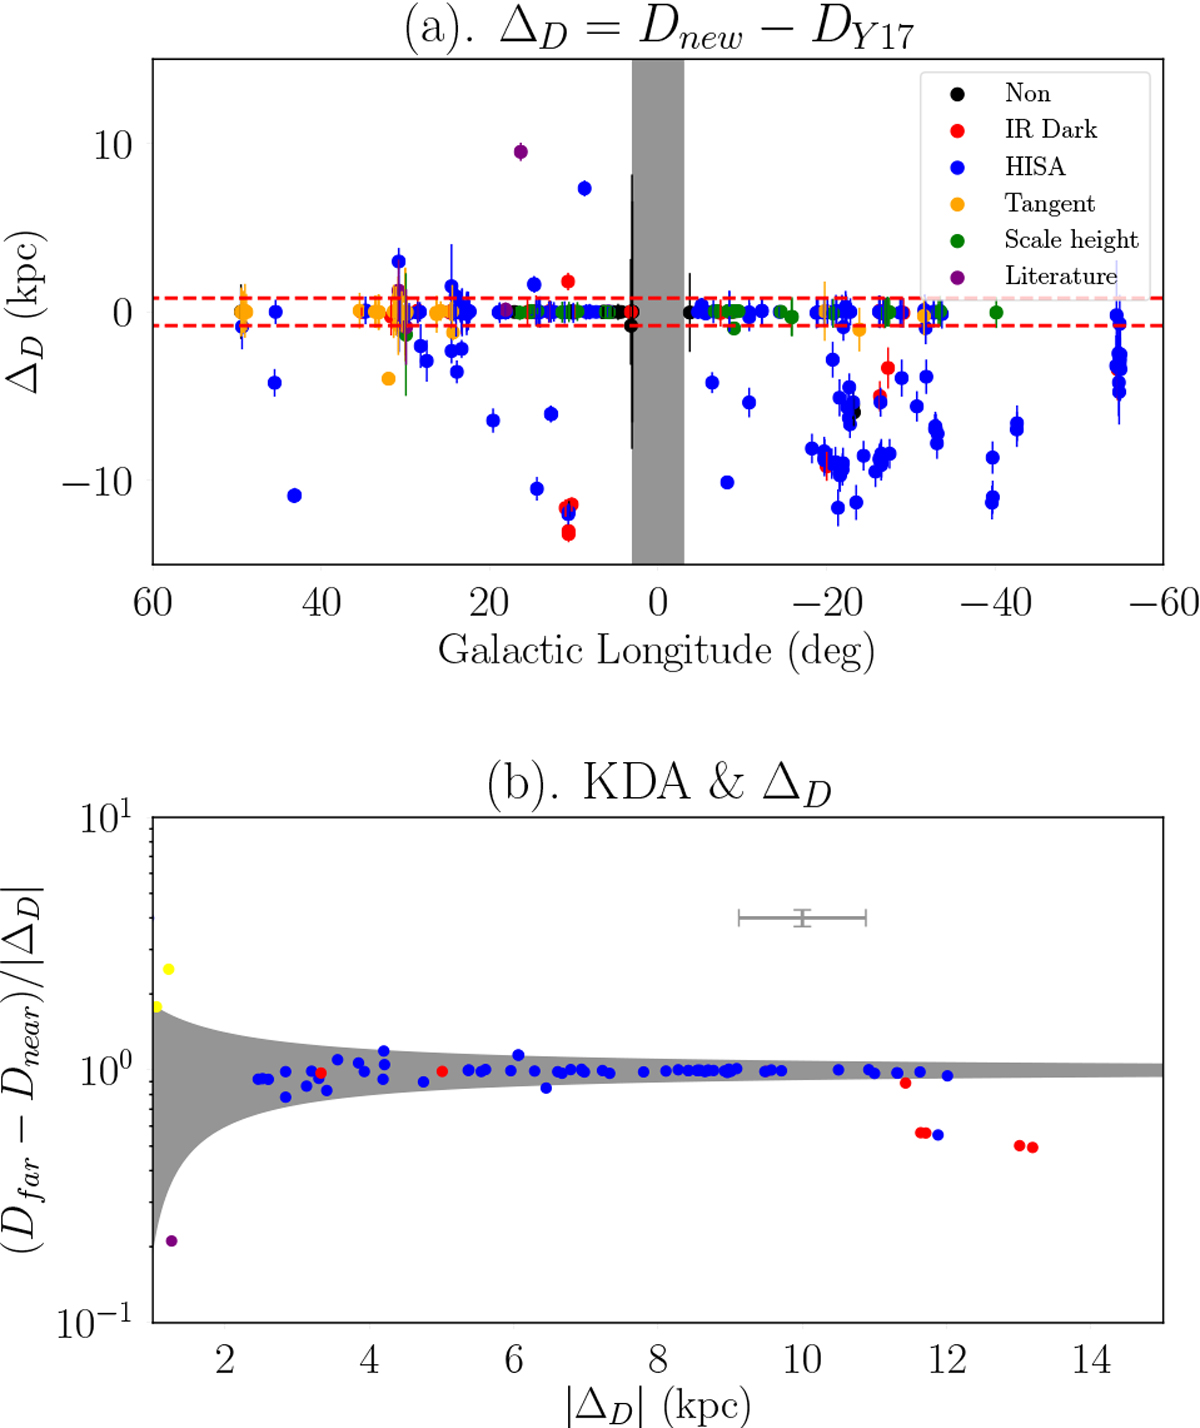
New distance of HMSC (this work) and those in Y17. Panel a: distance difference ΔD = Dnew − DY17. The red dashed lines show |ΔD| = 0.8 kpc, representing the 70th percentile of |ΔD|. The red,blue, orange, green, and purple dots mean that their KDA are solved by IR dark, H I SA, tangent, scale height, and literature, respectively (see Table 4 and Appendix A). The black dots are the sources without KDA solution. Panel b: |ΔD | and its relation with the difference between resulted far distance and near distance Dfar − Dnear. Only HMSCs with |ΔD| > 0.8 kpc and ![]() km s−1 are shown. The gray region shows (Dfar − Dnear)∕|ΔD| = 1 ± 0.8∕|ΔD|, indicating the error of relation. The gray cross shows the typical error.
km s−1 are shown. The gray region shows (Dfar − Dnear)∕|ΔD| = 1 ± 0.8∕|ΔD|, indicating the error of relation. The gray cross shows the typical error.
Current usage metrics show cumulative count of Article Views (full-text article views including HTML views, PDF and ePub downloads, according to the available data) and Abstracts Views on Vision4Press platform.
Data correspond to usage on the plateform after 2015. The current usage metrics is available 48-96 hours after online publication and is updated daily on week days.
Initial download of the metrics may take a while.