Fig. B.1
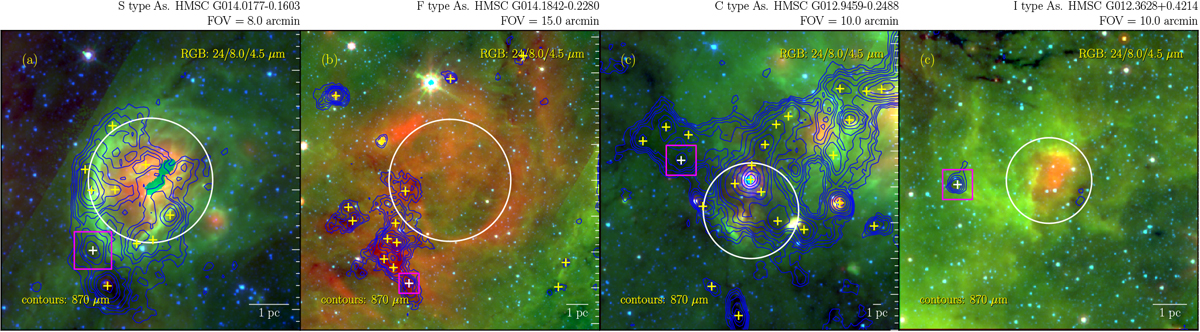
Example of a more detailed classification of the surroundings of HMSC. Four types of morphology are shown for AS. The RGB images are constructed in the same methods as in Fig. 1. The solid circles indicate the H II regions. Yellow crosses and blue contours represent the ATLASGAL clumps identified by Csengeri et al. (2014) and the ATLASGAL 870 μm emission, respectively.The white crosses with purple squares indicate the HMSCs.
Current usage metrics show cumulative count of Article Views (full-text article views including HTML views, PDF and ePub downloads, according to the available data) and Abstracts Views on Vision4Press platform.
Data correspond to usage on the plateform after 2015. The current usage metrics is available 48-96 hours after online publication and is updated daily on week days.
Initial download of the metrics may take a while.