Fig. 22
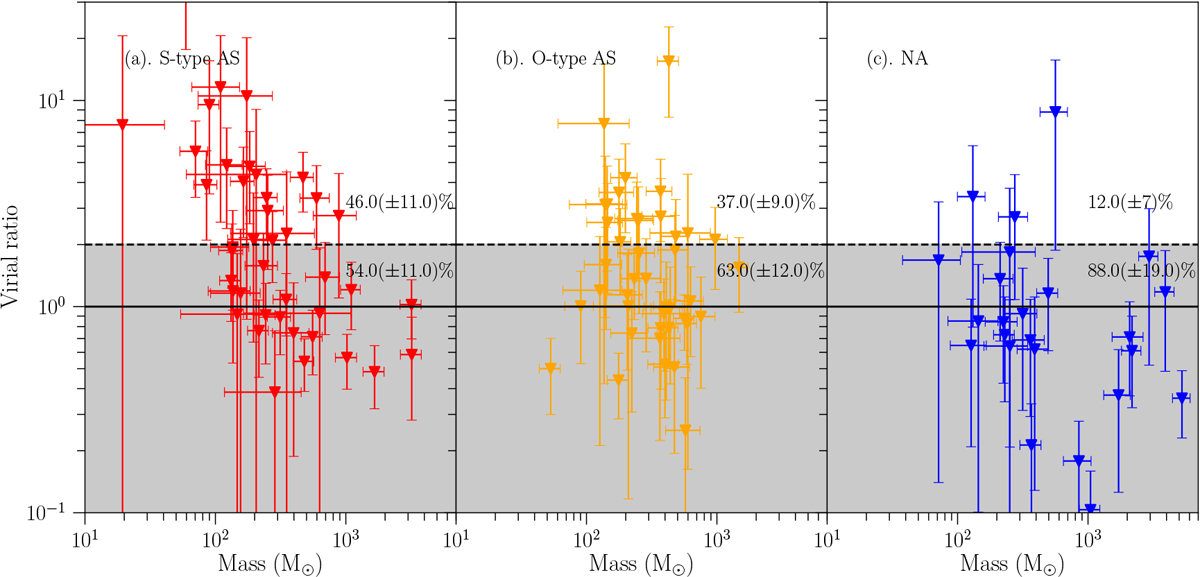
Virial ratios. The red, yellow, and blue triangles are similar to Fig. 20. The black dashed lines and gray regions show the region of virial ratio < 2. The solid lines represent virial ratio = 1. The numbers report the fractions of clumps with a virial ratio ≥ 2 and < 2. The uncertainties of clump mass and line width are propagated to the calculations of virial ratio.
Current usage metrics show cumulative count of Article Views (full-text article views including HTML views, PDF and ePub downloads, according to the available data) and Abstracts Views on Vision4Press platform.
Data correspond to usage on the plateform after 2015. The current usage metrics is available 48-96 hours after online publication and is updated daily on week days.
Initial download of the metrics may take a while.