Fig. 20
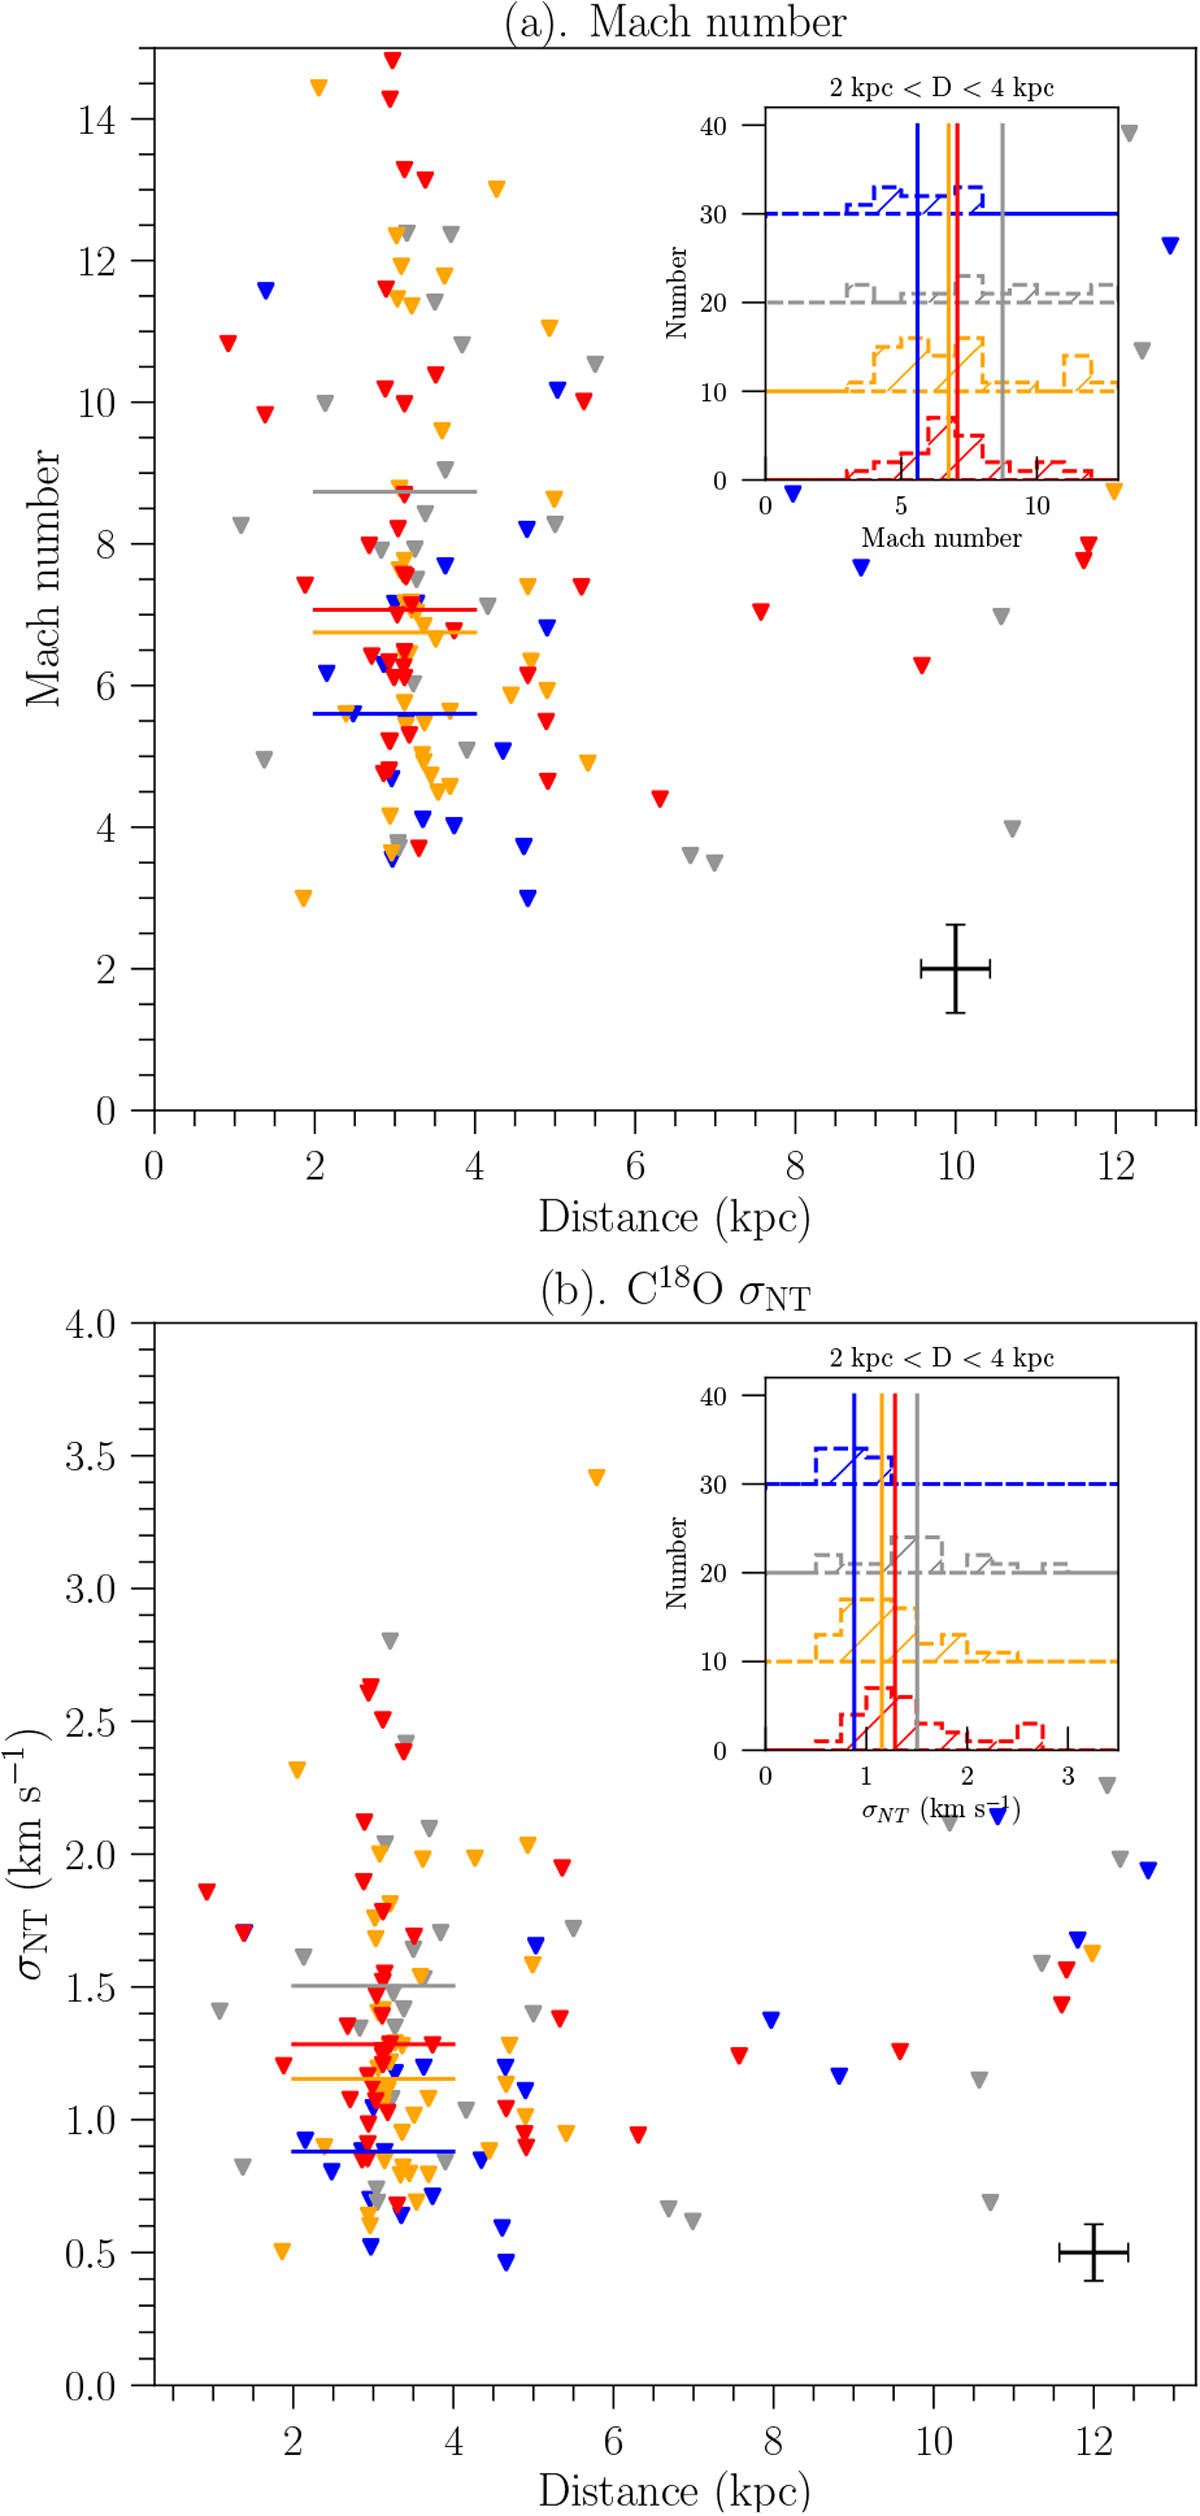
Turbulence. Panels a and b: Mach number and non-thermal component of HMSCs, respectively. The red, orange, gray and blue triangles represent S-type AS, O-type AS, PA, and NA, respectively. The corresponding median values for different HMSCs in the 2 to 4 kpc range are shown in short lines with corresponding colors. The histograms in top right show the number distributions in the range of 2 to 4 kpc and their median values.
Current usage metrics show cumulative count of Article Views (full-text article views including HTML views, PDF and ePub downloads, according to the available data) and Abstracts Views on Vision4Press platform.
Data correspond to usage on the plateform after 2015. The current usage metrics is available 48-96 hours after online publication and is updated daily on week days.
Initial download of the metrics may take a while.