Fig. 2
New HMSC vlsr
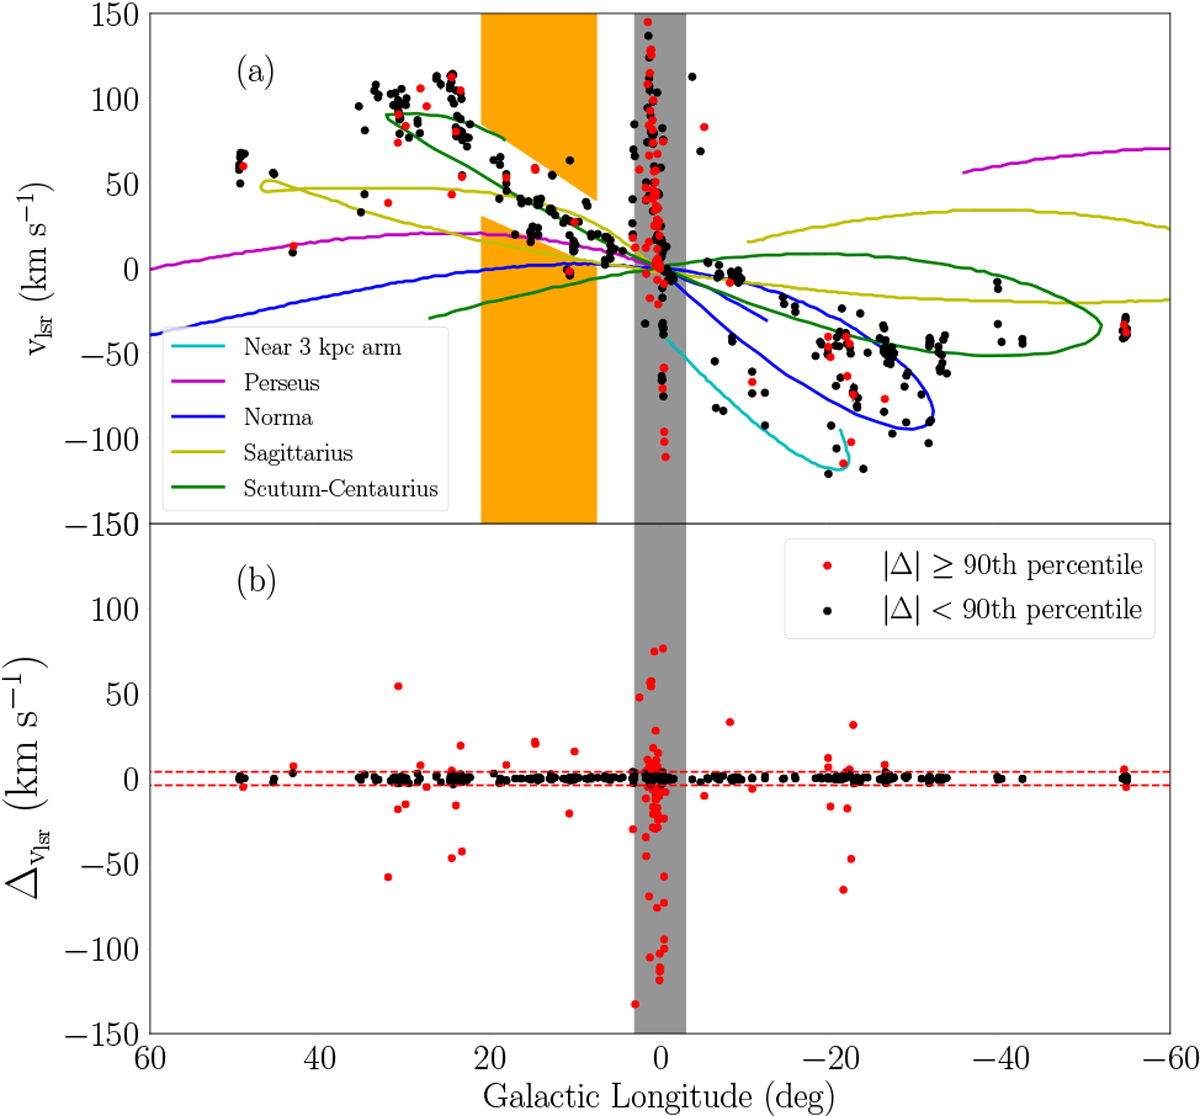
(this work) and those in Y17. Panels a and b: renewed vlsr
and difference between renewed vlsr
and those in Y17, ![]() , respectively. The 90th percentile of
, respectively. The 90th percentile of ![]() for HMSCs located at higher longitude (|l| > 3°) is 3.9 km s−1
, shown as red dashed lines in (b). The red and black dots represent HMSCs with
for HMSCs located at higher longitude (|l| > 3°) is 3.9 km s−1
, shown as red dashed lines in (b). The red and black dots represent HMSCs with
![]() values largerand smaller than 3.9 km s−1
, respectively. The gray region indicates the lower-longitude region, |l| < 3°, where the HMSCs are excluded from following analyses. Orange regions are considered by Ellsworth-Bowers et al. (2015). The four spiral and local arms are shown by different colors and their positions are taken from Urquhart et al. (2018) and its references Taylor & Cordes (1993) and Bronfman et al. (2000). Most of the errors of vlsr are less than 2 km s−1 and the associated error bars are smaller than the point size in (a).
values largerand smaller than 3.9 km s−1
, respectively. The gray region indicates the lower-longitude region, |l| < 3°, where the HMSCs are excluded from following analyses. Orange regions are considered by Ellsworth-Bowers et al. (2015). The four spiral and local arms are shown by different colors and their positions are taken from Urquhart et al. (2018) and its references Taylor & Cordes (1993) and Bronfman et al. (2000). Most of the errors of vlsr are less than 2 km s−1 and the associated error bars are smaller than the point size in (a).
Current usage metrics show cumulative count of Article Views (full-text article views including HTML views, PDF and ePub downloads, according to the available data) and Abstracts Views on Vision4Press platform.
Data correspond to usage on the plateform after 2015. The current usage metrics is available 48-96 hours after online publication and is updated daily on week days.
Initial download of the metrics may take a while.