Open Access
Fig. 18
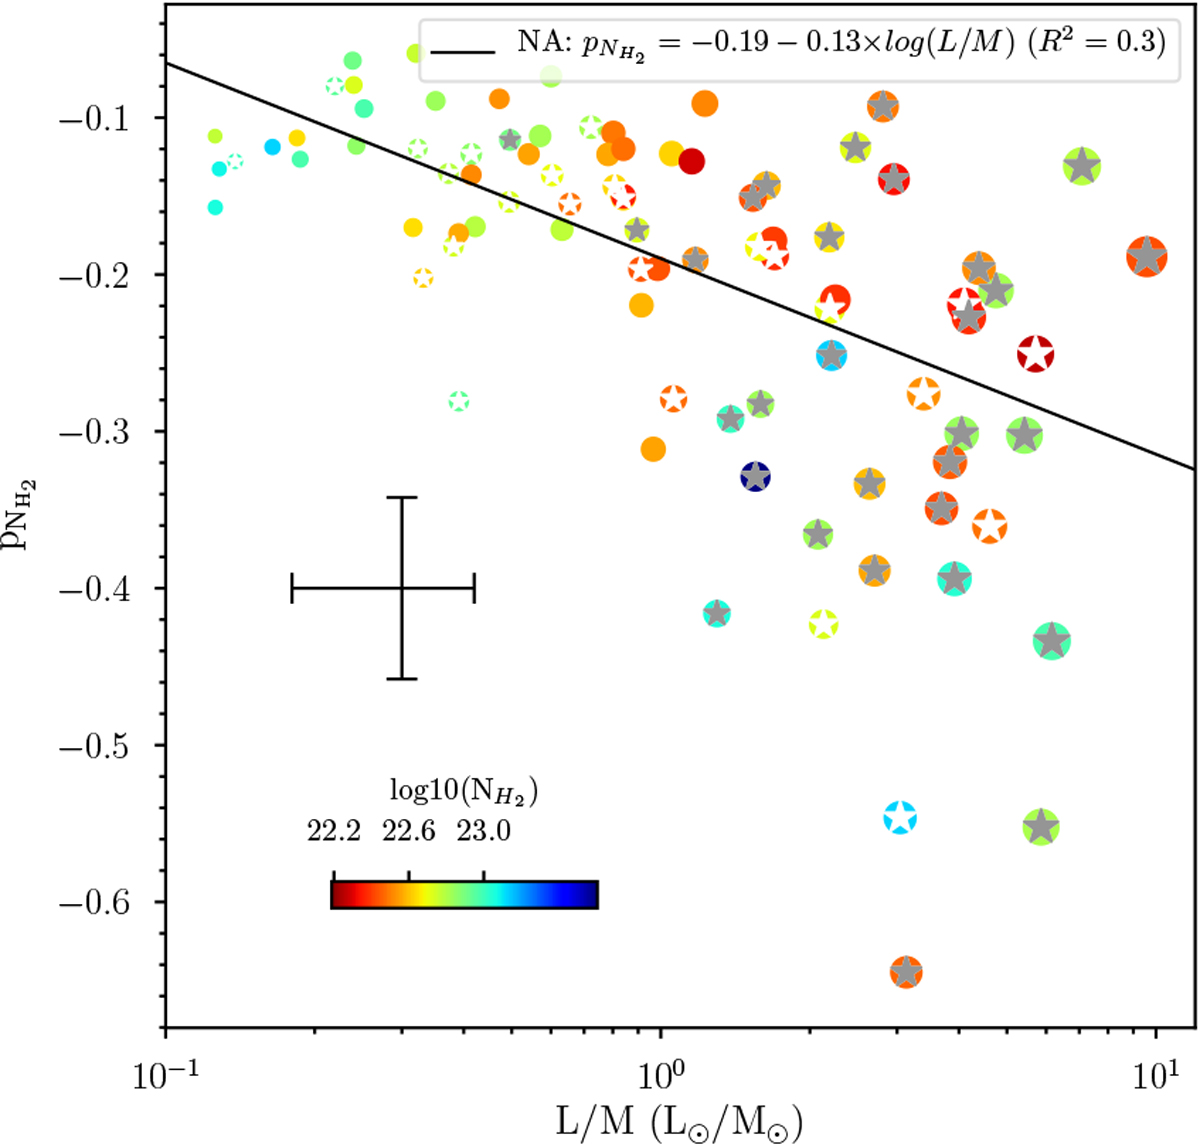
Plot of L∕M
and ![]() . The meanings of different dots are similar to Fig. 17a. The colors of dots indicate
. The meanings of different dots are similar to Fig. 17a. The colors of dots indicate
![]() of HMSCs. The size of the dot is proportional to the Tdust
. The cross represents the typical error. The black line indicates the linear regression to the data.
of HMSCs. The size of the dot is proportional to the Tdust
. The cross represents the typical error. The black line indicates the linear regression to the data.
Current usage metrics show cumulative count of Article Views (full-text article views including HTML views, PDF and ePub downloads, according to the available data) and Abstracts Views on Vision4Press platform.
Data correspond to usage on the plateform after 2015. The current usage metrics is available 48-96 hours after online publication and is updated daily on week days.
Initial download of the metrics may take a while.