Fig. 17
Power-law index of ![]() and Tdust
profile. The whole Tdust
and
and Tdust
profile. The whole Tdust
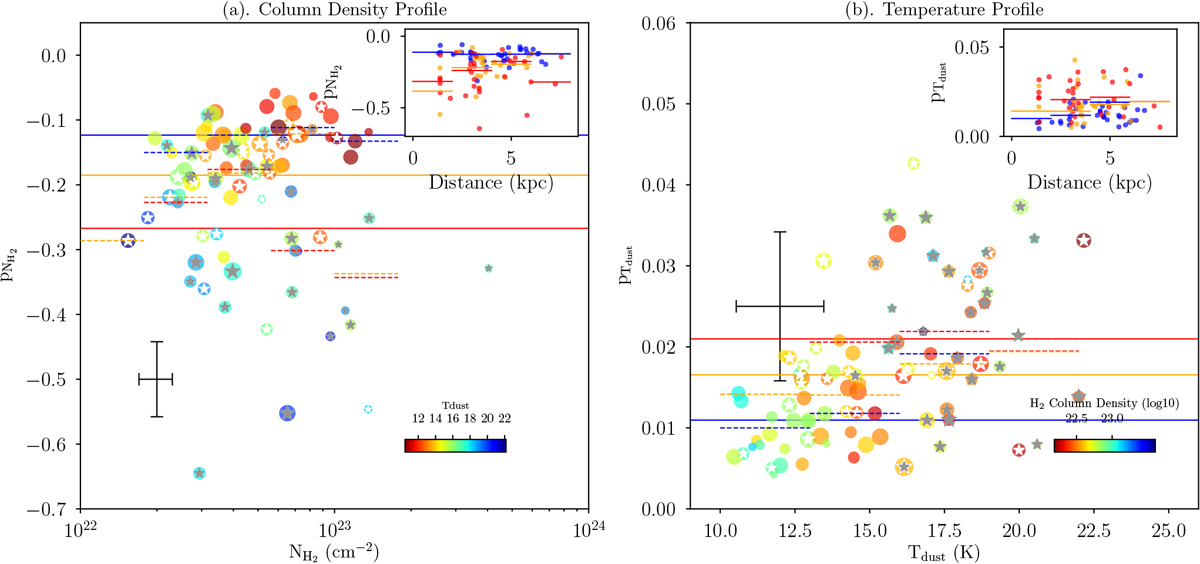
and ![]() of the clump are taken from updated Y17 properties in this paper. The p values are derivedfrom Hi-GAL PPMAP data. Panels a and b: column density and dust temperature power-law index p, respectively.The crosses represent the typical errors. The dots with gray stars, white stars, and without stars represent the S-type AS, O-type AS, and NA HMSCs, respectively. The red, orange, and blue solid lines represent the median values for S-type AS, O-type AS, and NA, respectively. The red, orange, and blue dashed lines represent the median values for S-type AS, O-type AS, and NA in the corresponding column density or temperature bins. Sub-figures in the top right show the power-law index and its relation with distance. The red, orange, and blue dots represent S-type AS, O-type AS, and NA, respectively. The red, orange, and blue short lines show the median values in different distance bins for the corresponding types of HMSCs.
of the clump are taken from updated Y17 properties in this paper. The p values are derivedfrom Hi-GAL PPMAP data. Panels a and b: column density and dust temperature power-law index p, respectively.The crosses represent the typical errors. The dots with gray stars, white stars, and without stars represent the S-type AS, O-type AS, and NA HMSCs, respectively. The red, orange, and blue solid lines represent the median values for S-type AS, O-type AS, and NA, respectively. The red, orange, and blue dashed lines represent the median values for S-type AS, O-type AS, and NA in the corresponding column density or temperature bins. Sub-figures in the top right show the power-law index and its relation with distance. The red, orange, and blue dots represent S-type AS, O-type AS, and NA, respectively. The red, orange, and blue short lines show the median values in different distance bins for the corresponding types of HMSCs.
Current usage metrics show cumulative count of Article Views (full-text article views including HTML views, PDF and ePub downloads, according to the available data) and Abstracts Views on Vision4Press platform.
Data correspond to usage on the plateform after 2015. The current usage metrics is available 48-96 hours after online publication and is updated daily on week days.
Initial download of the metrics may take a while.