Fig. 16
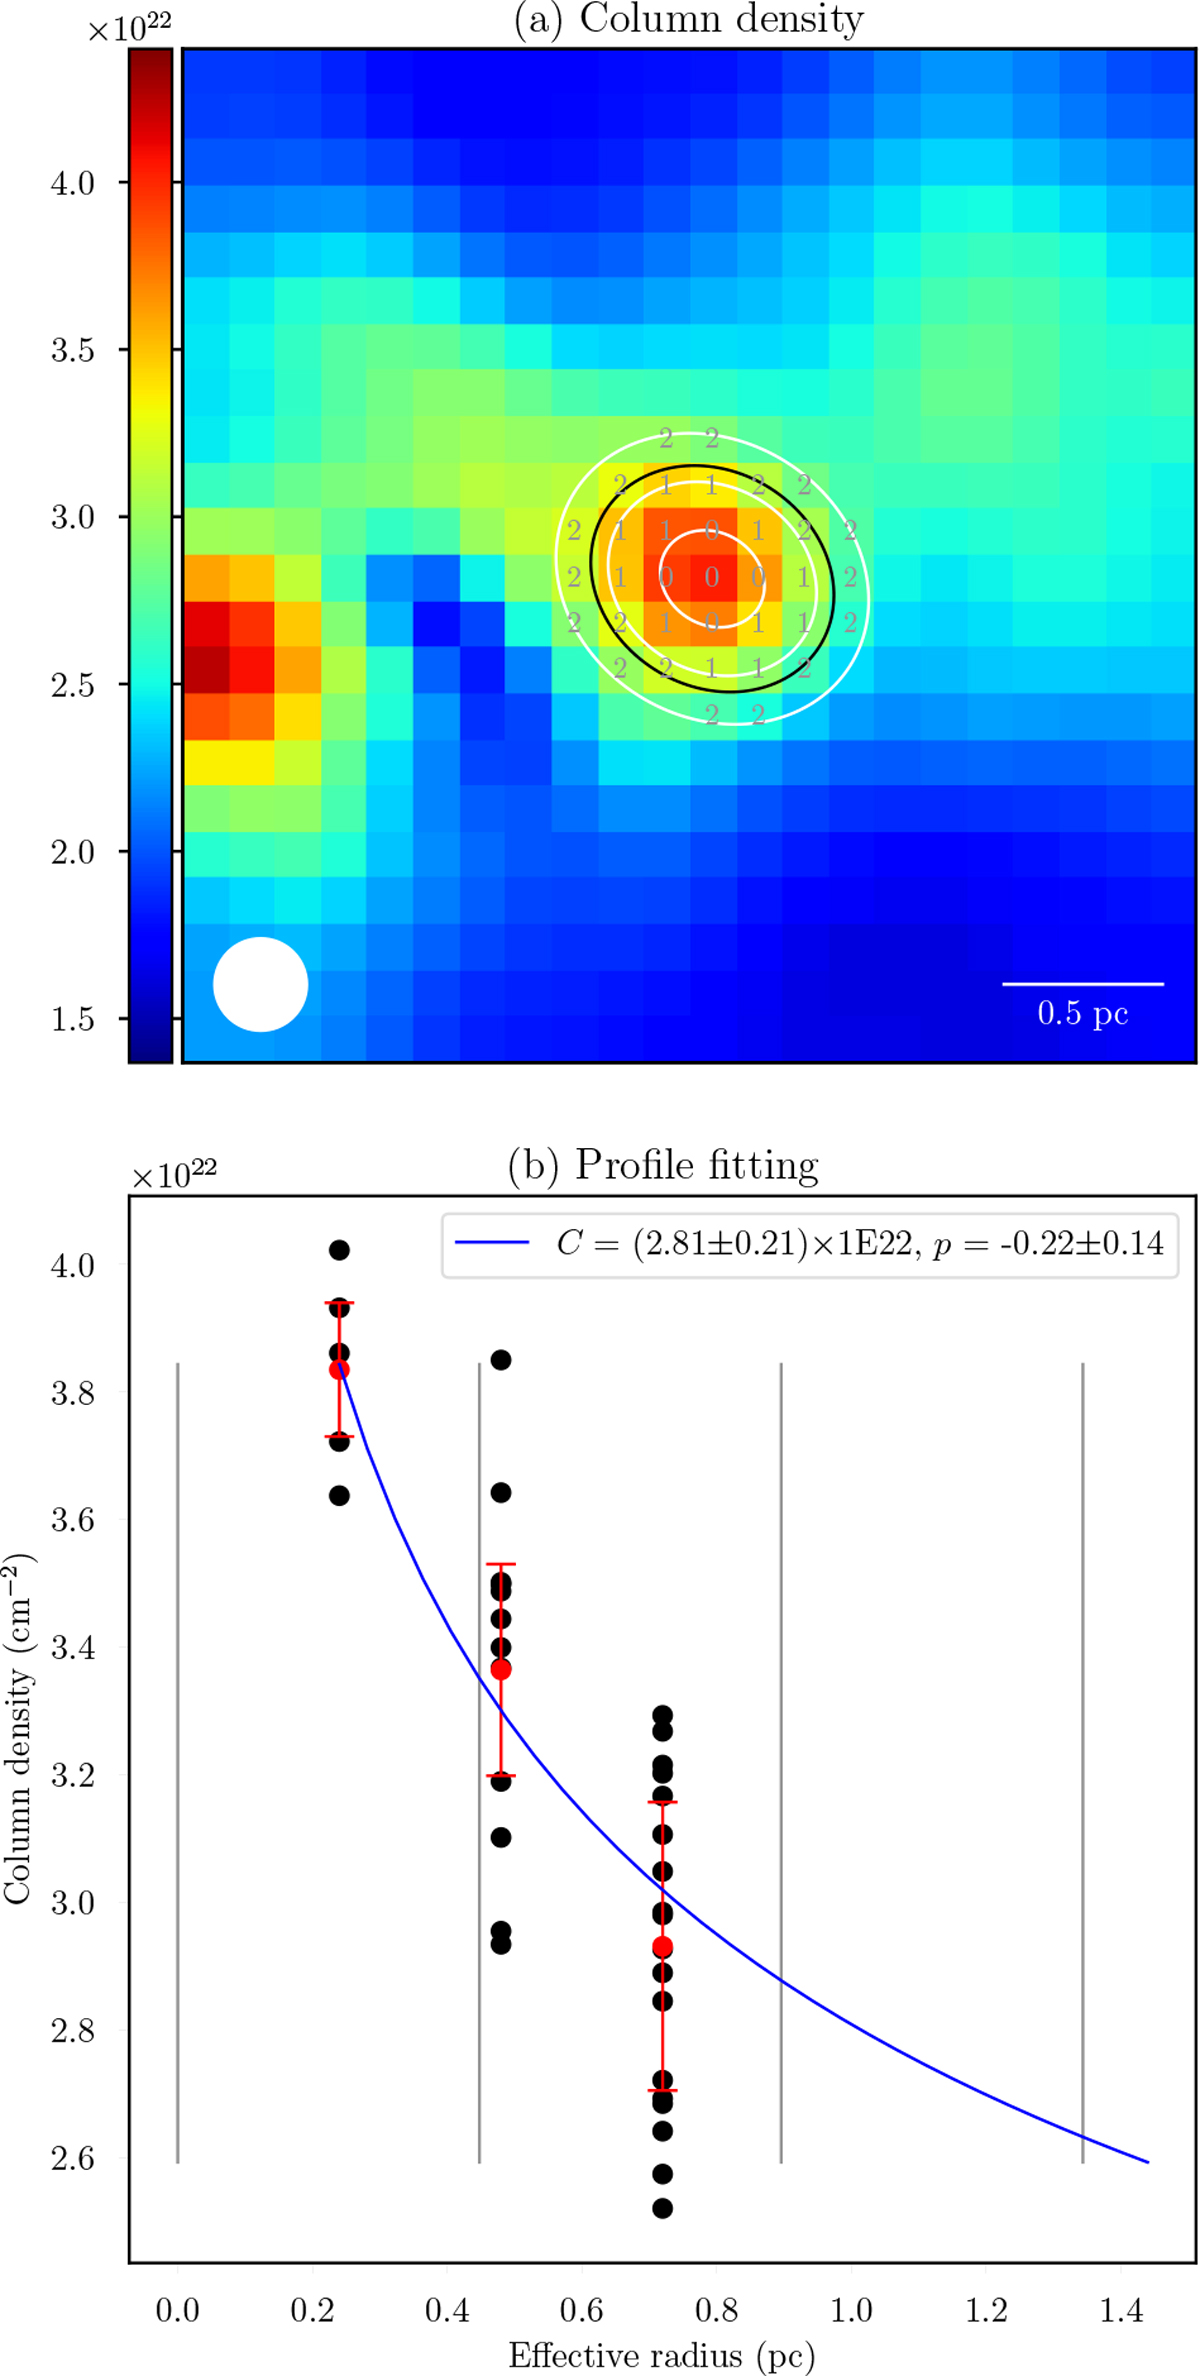
Column density profile fitting for HMSC G010.9823−0.3677. Panel a: PPMAP ![]() . The black and white ellipses represent the clump and its shells used for extracting pixels. The gray numbers denote the corresponding shells of the pixels. The beam of PPMAP is shown in bottom left. Panel b: profile fitting. The black and red dots indicate the PPMAP
. The black and white ellipses represent the clump and its shells used for extracting pixels. The gray numbers denote the corresponding shells of the pixels. The beam of PPMAP is shown in bottom left. Panel b: profile fitting. The black and red dots indicate the PPMAP
![]() and their median values in the corresponding shells. The error of
and their median values in the corresponding shells. The error of ![]() value of each shell is estimated by the 25th and 75th percentiles of
value of each shell is estimated by the 25th and 75th percentiles of ![]() of each shell, which is shown by the red error bar. The blue line is the fitting result for median values. The gray lines show the triple beams of PPMAP.
of each shell, which is shown by the red error bar. The blue line is the fitting result for median values. The gray lines show the triple beams of PPMAP.
Current usage metrics show cumulative count of Article Views (full-text article views including HTML views, PDF and ePub downloads, according to the available data) and Abstracts Views on Vision4Press platform.
Data correspond to usage on the plateform after 2015. The current usage metrics is available 48-96 hours after online publication and is updated daily on week days.
Initial download of the metrics may take a while.