Fig. 15
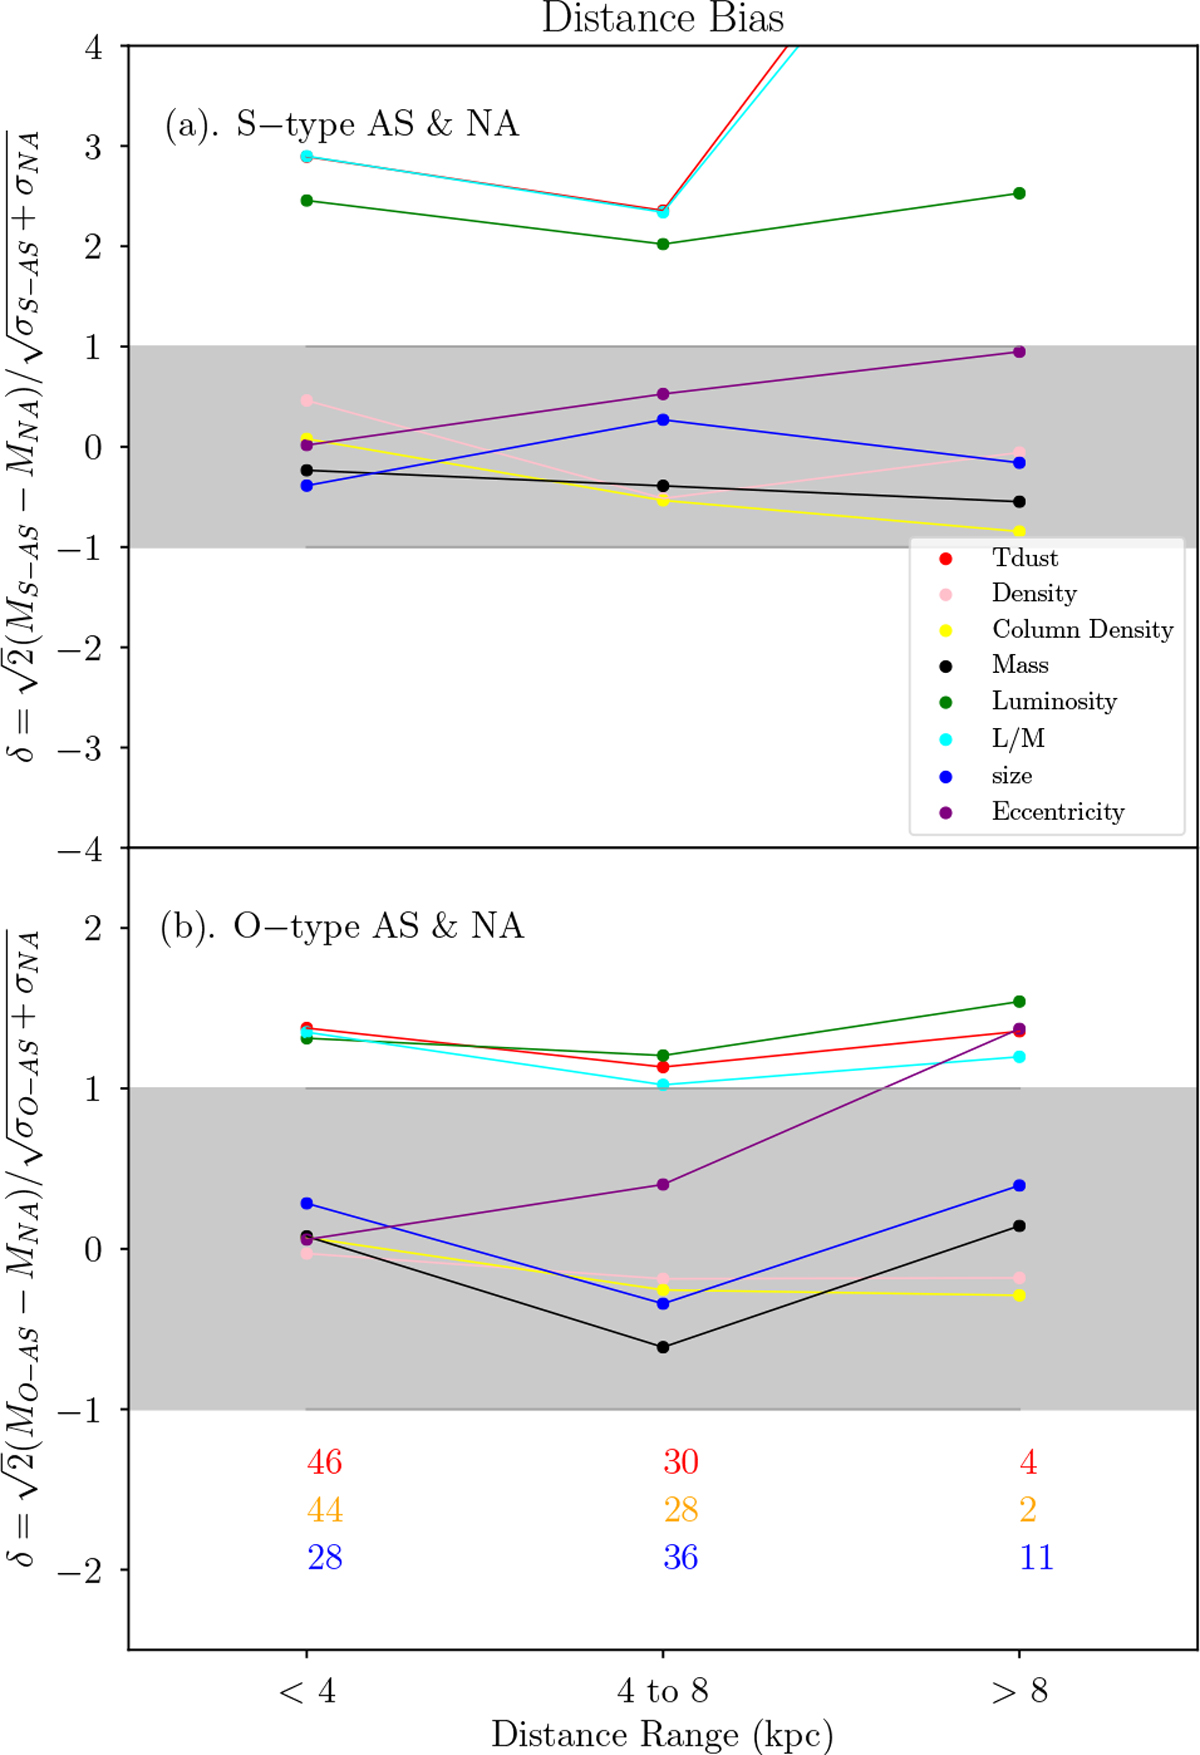
Distance bias. Panels a and b: δ values for the combination of S-type AS and NA, and the combination of O-type AS and NA HMSCs, respectively. All sources are grouped into three distance bins, which are <4 kpc, 4–8 kpc, and >8 kpc. Dots withdifferent colors mean different properties of HMSCs. The red, orange, and blue numbers in (b) are the numbers of S-type AS, O-type AS, and NA HMSCs in the corresponding distance ranges. The gray regions are |δ| ≤ 1, where we suggest that the differences are insignificant.
Current usage metrics show cumulative count of Article Views (full-text article views including HTML views, PDF and ePub downloads, according to the available data) and Abstracts Views on Vision4Press platform.
Data correspond to usage on the plateform after 2015. The current usage metrics is available 48-96 hours after online publication and is updated daily on week days.
Initial download of the metrics may take a while.