Fig. 12
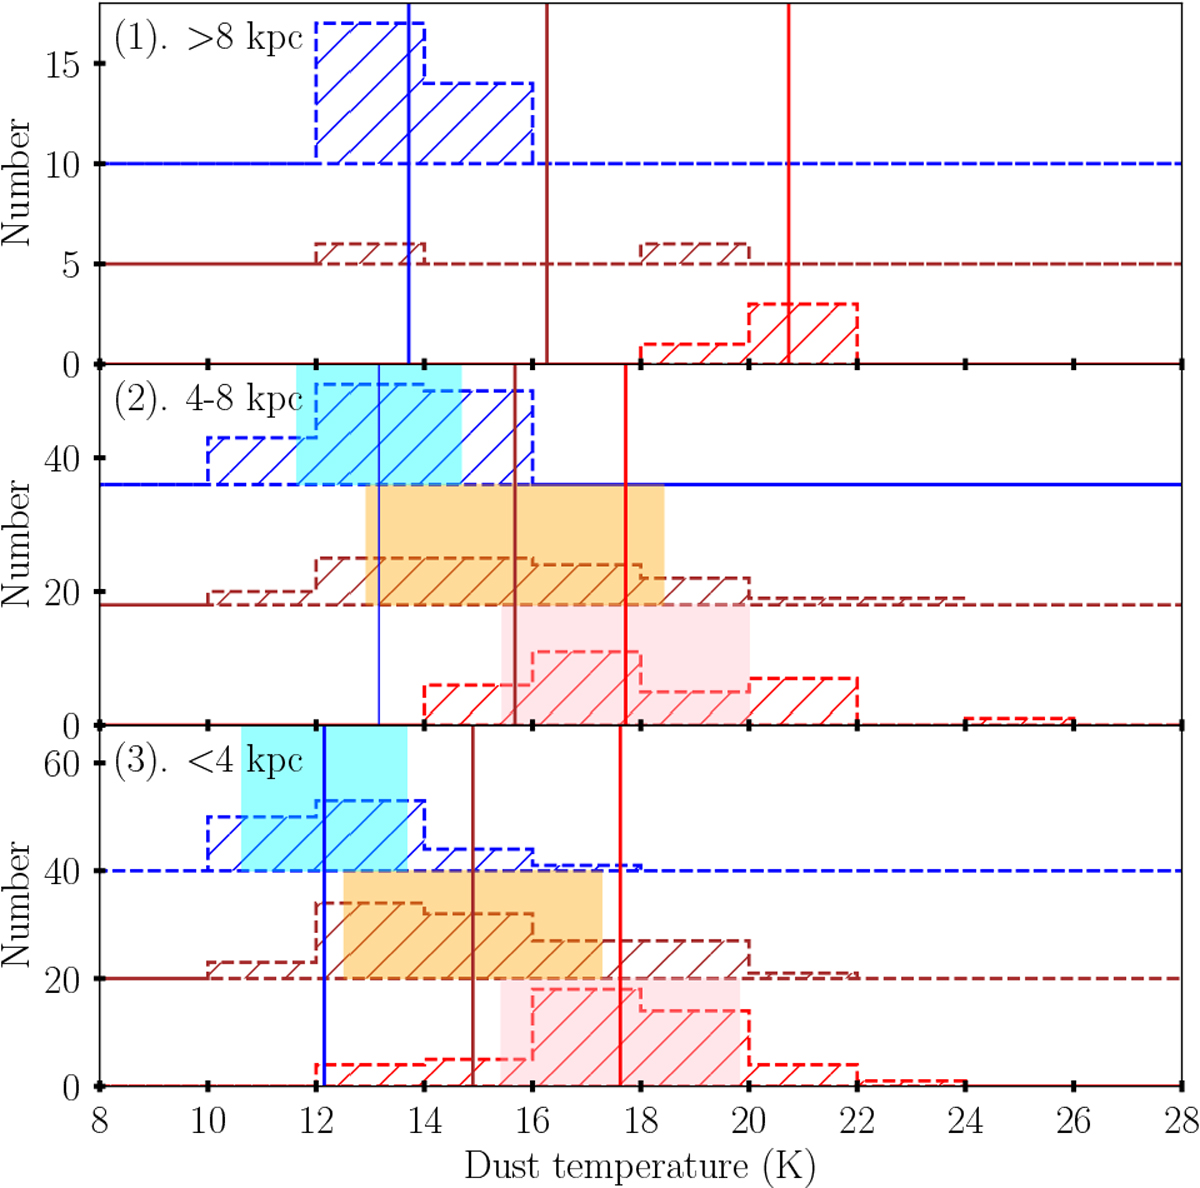
Number distributions of Tdust of HMSCs. Three panels from bottom to top: number distributions in the distance ranges of <4 kpc, 4–8 kpc, and >8 kpc, respectively. The red, dark brown, and blue histograms represent the number distributions for S-type AS, O-type AS, and NA, respectively. The solid lines indicate their median values. The pink, brown, and cyan filled color regions have a full width of double standard deviation 2σ and center at median value of corresponding types of HMSCs.
Current usage metrics show cumulative count of Article Views (full-text article views including HTML views, PDF and ePub downloads, according to the available data) and Abstracts Views on Vision4Press platform.
Data correspond to usage on the plateform after 2015. The current usage metrics is available 48-96 hours after online publication and is updated daily on week days.
Initial download of the metrics may take a while.