Free Access
Fig. 3.
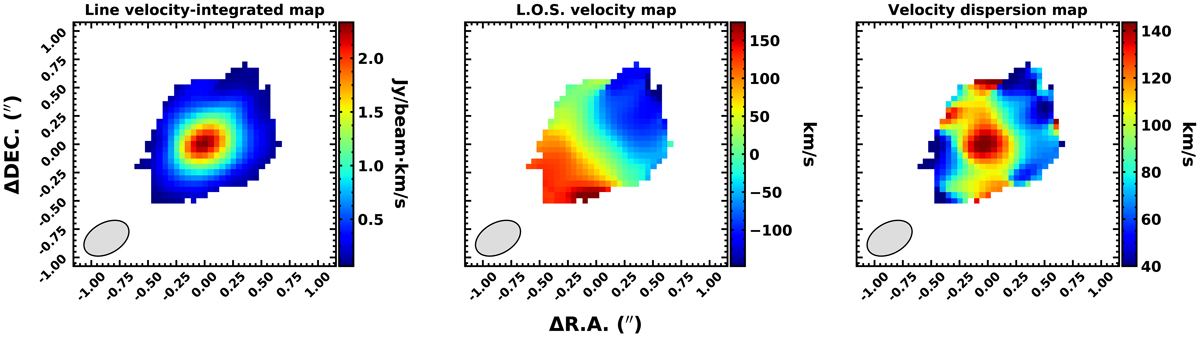
Observed maps of SDSS J0923+0247. From left panel to right: flux map, velocity map, and velocity-dispersion map along the line of sight, respectively. At the bottom-left corner of each panel, we report the ALMA synthesised beam FWHM. The coordinates indicate offsets with respect to the map centre.
Current usage metrics show cumulative count of Article Views (full-text article views including HTML views, PDF and ePub downloads, according to the available data) and Abstracts Views on Vision4Press platform.
Data correspond to usage on the plateform after 2015. The current usage metrics is available 48-96 hours after online publication and is updated daily on week days.
Initial download of the metrics may take a while.