Free Access
Fig. D.1.
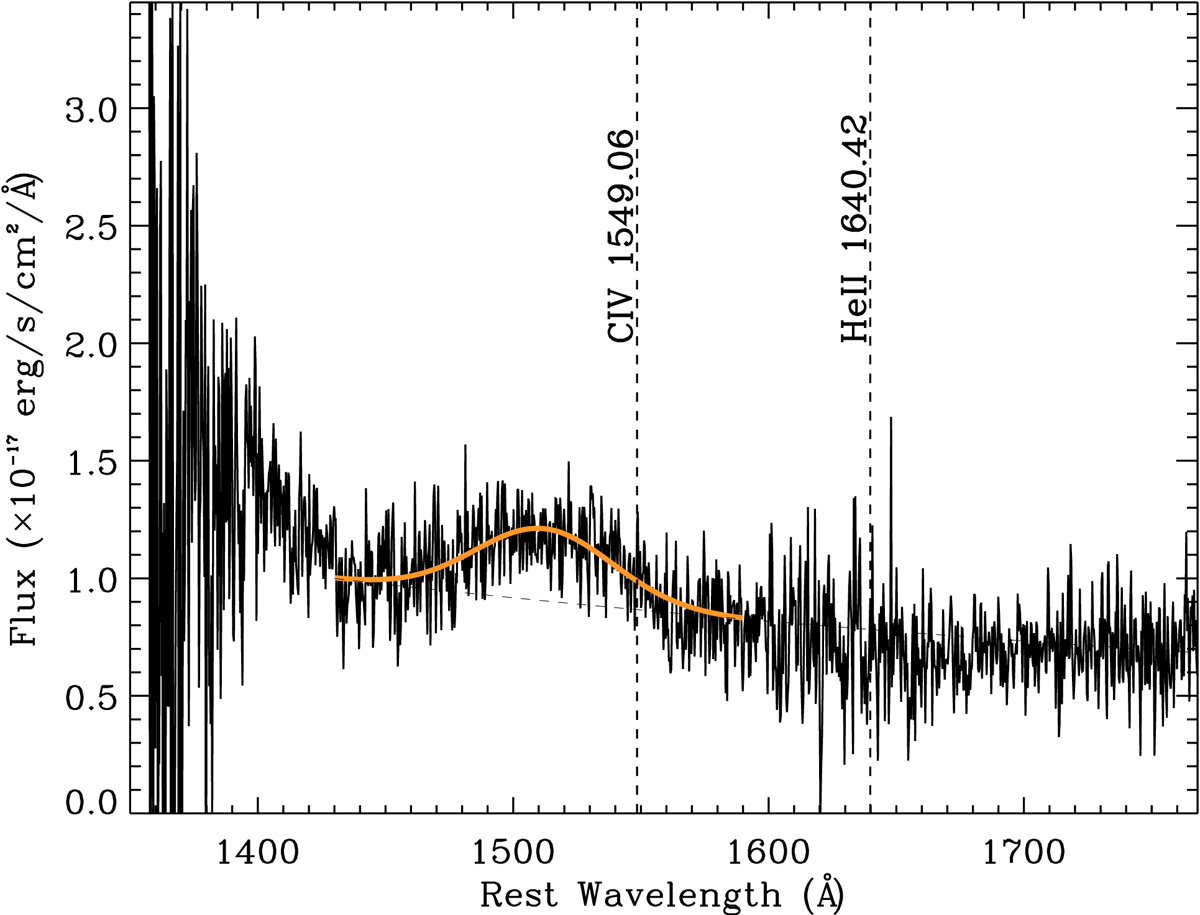
Portion of LBT/LUCI zJ spectrum of SDSS J2310+1855 around CIV line for which the expected wavelength is indicated in the figure according to [CII]-based redshift. The orange and black dashed curves indicate the spectrum’s best fit (line + continuum and continuum, respectively).
Current usage metrics show cumulative count of Article Views (full-text article views including HTML views, PDF and ePub downloads, according to the available data) and Abstracts Views on Vision4Press platform.
Data correspond to usage on the plateform after 2015. The current usage metrics is available 48-96 hours after online publication and is updated daily on week days.
Initial download of the metrics may take a while.