Fig. 6.
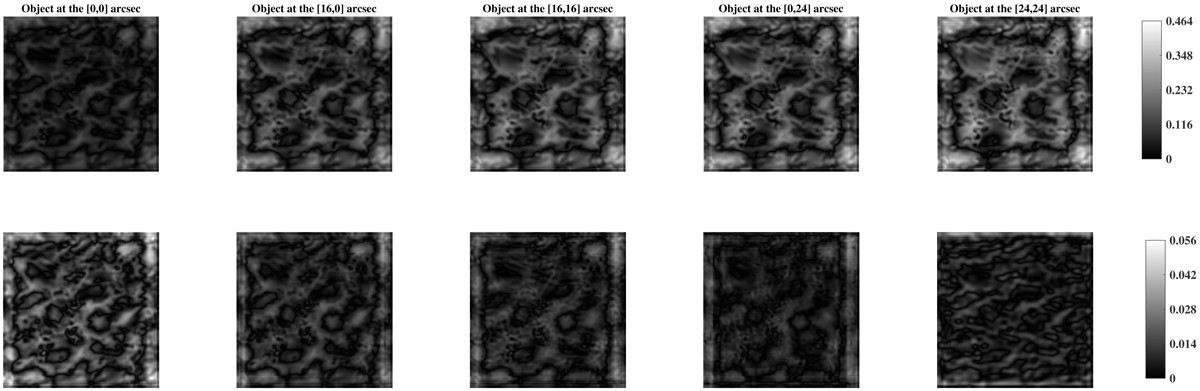
Absolute distance between the reconstructions and the object at the tested field angles. The results at the top row are calculated from the generic average height and the results at the bottom row are calculated from equivalent height. The turbulence profile follows the HV 5-7 model. A common scale for those images that correspond to the same used height is used and the scales for different heights are different. The scales of the images corresponding to the same height are placed at the right side of the images.
Current usage metrics show cumulative count of Article Views (full-text article views including HTML views, PDF and ePub downloads, according to the available data) and Abstracts Views on Vision4Press platform.
Data correspond to usage on the plateform after 2015. The current usage metrics is available 48-96 hours after online publication and is updated daily on week days.
Initial download of the metrics may take a while.