Fig. 15.
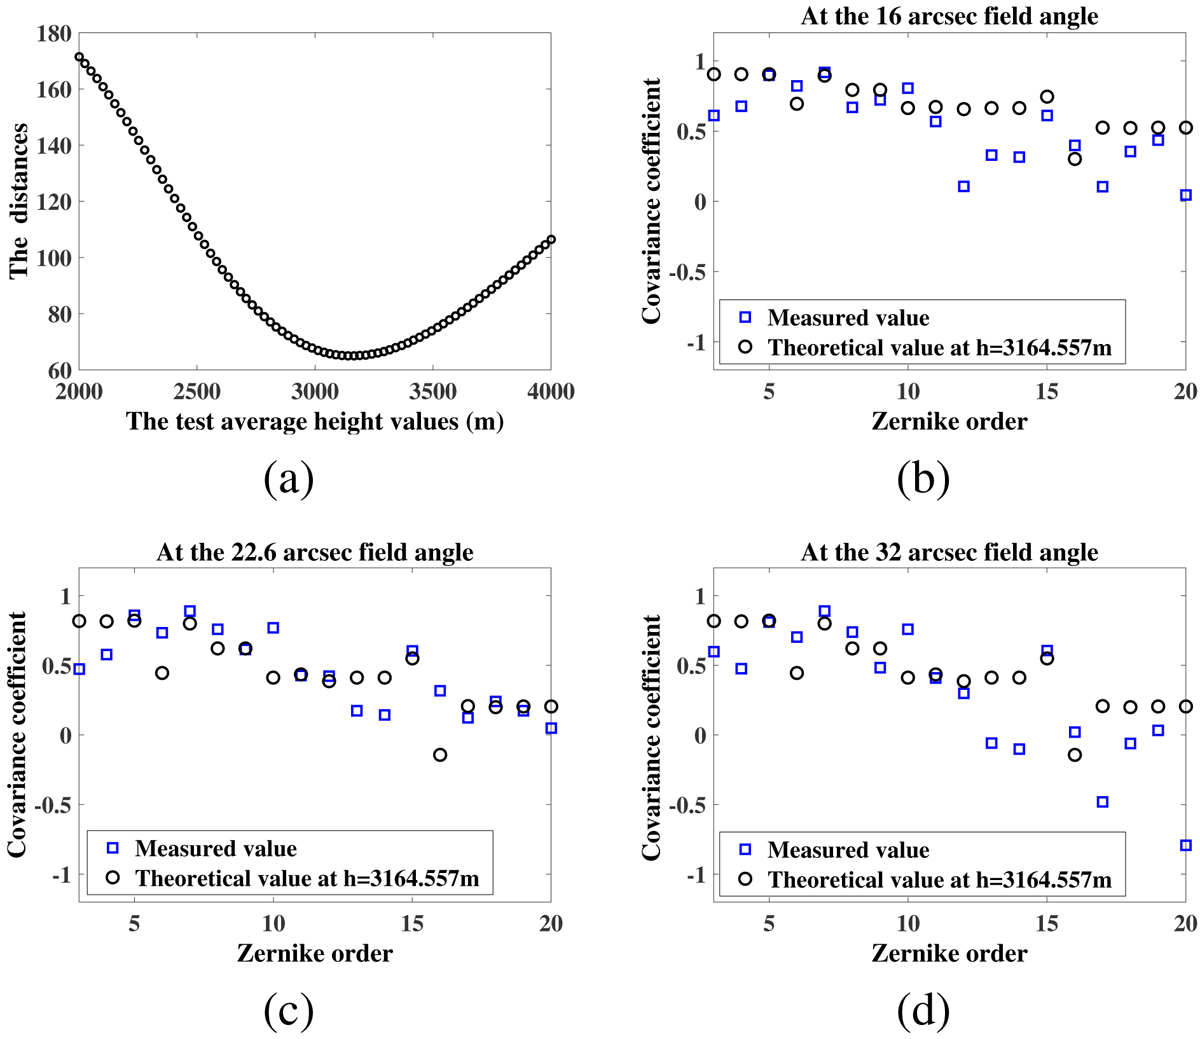
Panel a: sum of the Euclidian distance between the experimental covariance coefficients and the analytical values calculated from Eq. (13) with different equivalent height values. The equivalent height values are distributed from 2000 m to 4000 m with 80 steps and the best fitted equivalent height is 3164.6 m. Panels b–d: experimental values and best-fit analytical values when the separated field angle are 16″, 22.6″, 32″, respectively.
Current usage metrics show cumulative count of Article Views (full-text article views including HTML views, PDF and ePub downloads, according to the available data) and Abstracts Views on Vision4Press platform.
Data correspond to usage on the plateform after 2015. The current usage metrics is available 48-96 hours after online publication and is updated daily on week days.
Initial download of the metrics may take a while.