Fig. A.1
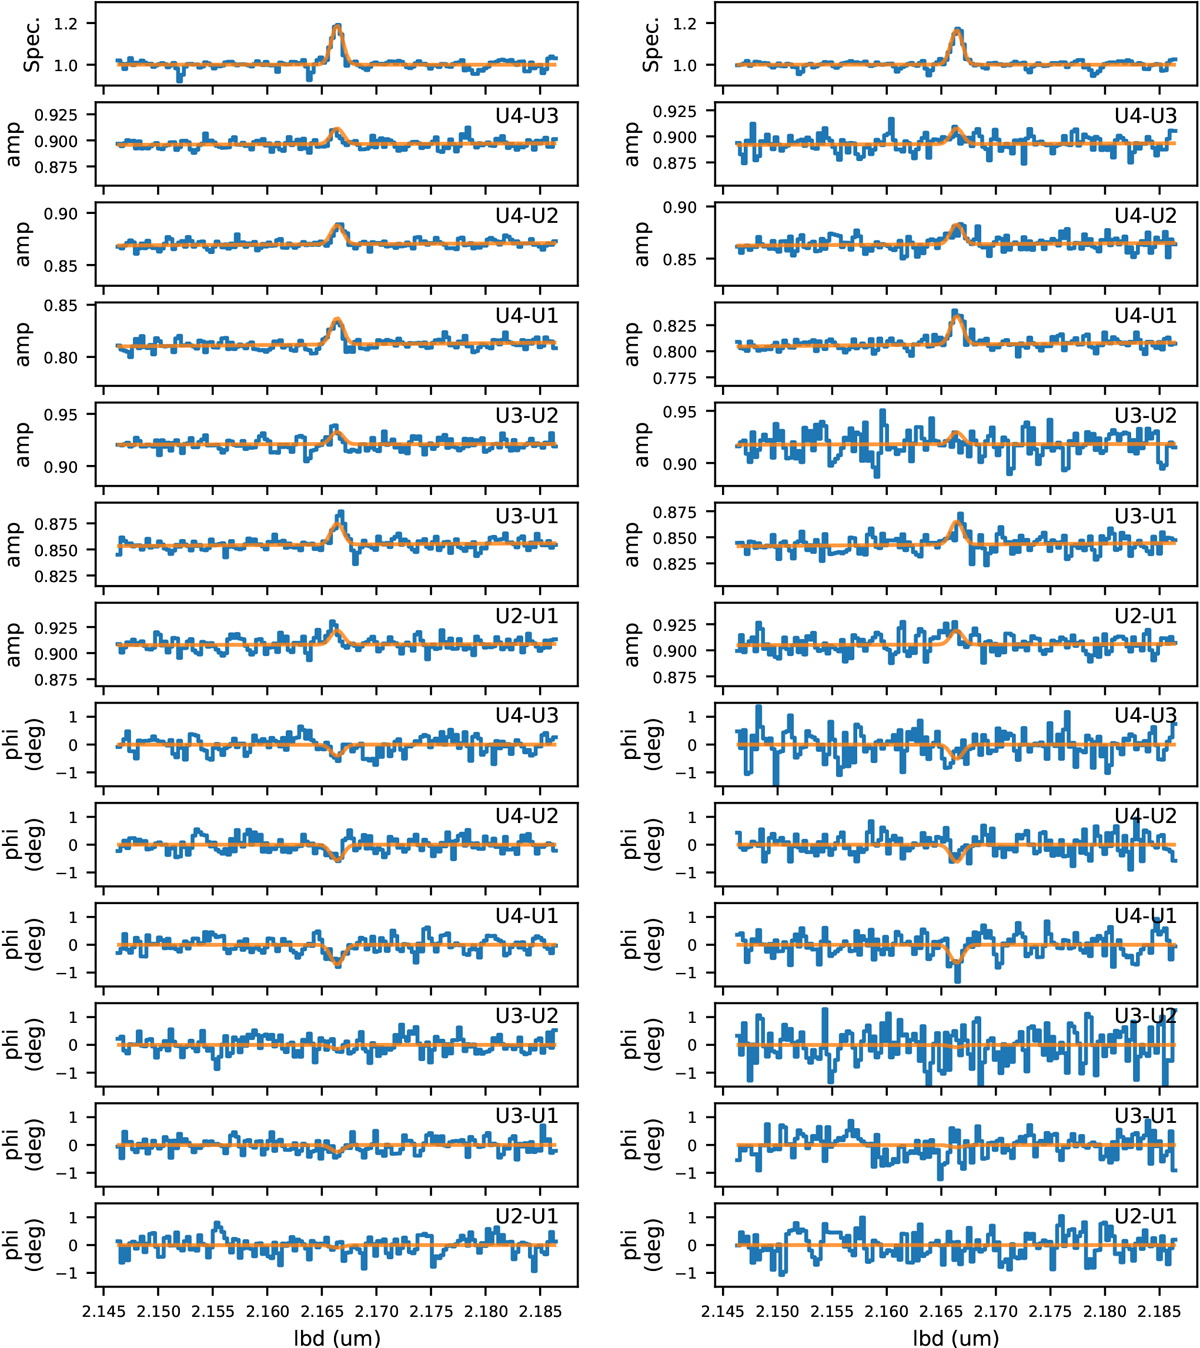
Spectrally dispersed interferometric observables around the Brγ line for the night 2019-06-22 (left) and 2019-06-23 (right) along the 6 UT baselines. Top row: intensity spectrum where the Br γ line is clearly visible in emission at 2.166 μm.Next 6 rows: visibility amplitudes, and lower 6: differential phases. For all observables, the continuum has been normalized to reproduce the predictions of the model of the FT data, and only the parameters related to the Brγ emission areadjusted. The best-fit model is shown in orange.
Current usage metrics show cumulative count of Article Views (full-text article views including HTML views, PDF and ePub downloads, according to the available data) and Abstracts Views on Vision4Press platform.
Data correspond to usage on the plateform after 2015. The current usage metrics is available 48-96 hours after online publication and is updated daily on week days.
Initial download of the metrics may take a while.