Fig. 2
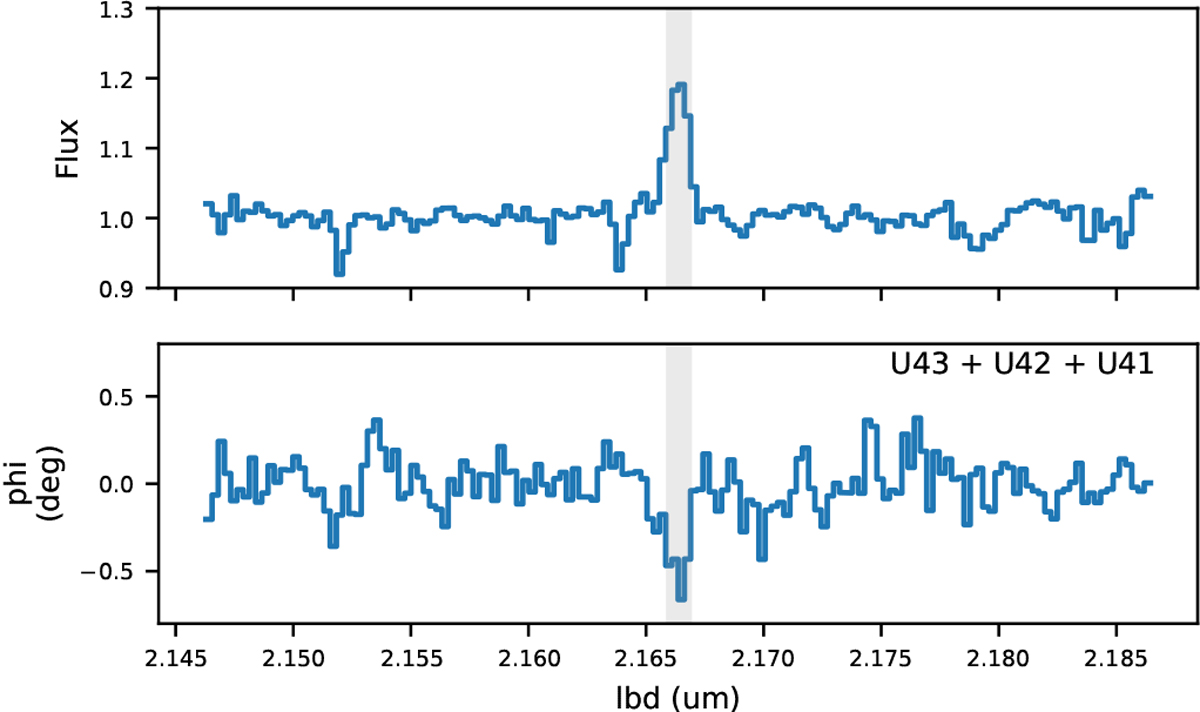
Top panel: spectrum around the Brγ line for the night 2019-06-22. The gray area shows the extent of the Brγ line profile. Bottom panel: mean of the differential phase of the three baselines UT4-UT3, UT4-UT2, and UT4-UT1 for the night 2019-06-22. The standard deviation of the summed signal is 0.16°. The averaged phase signal is detected across the line profile at the 4σ level.
Current usage metrics show cumulative count of Article Views (full-text article views including HTML views, PDF and ePub downloads, according to the available data) and Abstracts Views on Vision4Press platform.
Data correspond to usage on the plateform after 2015. The current usage metrics is available 48-96 hours after online publication and is updated daily on week days.
Initial download of the metrics may take a while.