Fig. 1
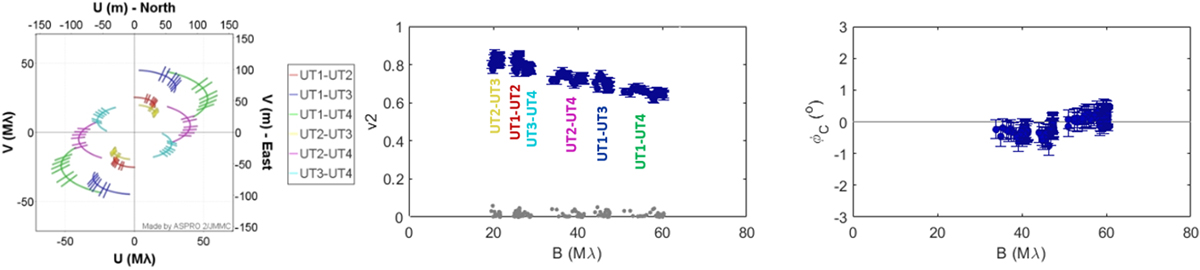
GRAVITY observations of DoAr 44 on June, 22. Left: (u, v) spatial frequency plane corresponding to the six projected baselines during the 3.7 h of observations. Middle: continuum squared visibilities as a function of baseline, recorded in the central spectral channel of the fringe tracker (λ = 2.15 μm). The gray circles at the bottom of the panel correspond to the residuals after the best fit model has been subtracted (see text). Right: closure phases measured in the central spectral channel as a function of baseline. The error bars amount to 2% on the squared visibilities and 0.3° on the closure phases (see text for details).
Current usage metrics show cumulative count of Article Views (full-text article views including HTML views, PDF and ePub downloads, according to the available data) and Abstracts Views on Vision4Press platform.
Data correspond to usage on the plateform after 2015. The current usage metrics is available 48-96 hours after online publication and is updated daily on week days.
Initial download of the metrics may take a while.