Fig. 9.
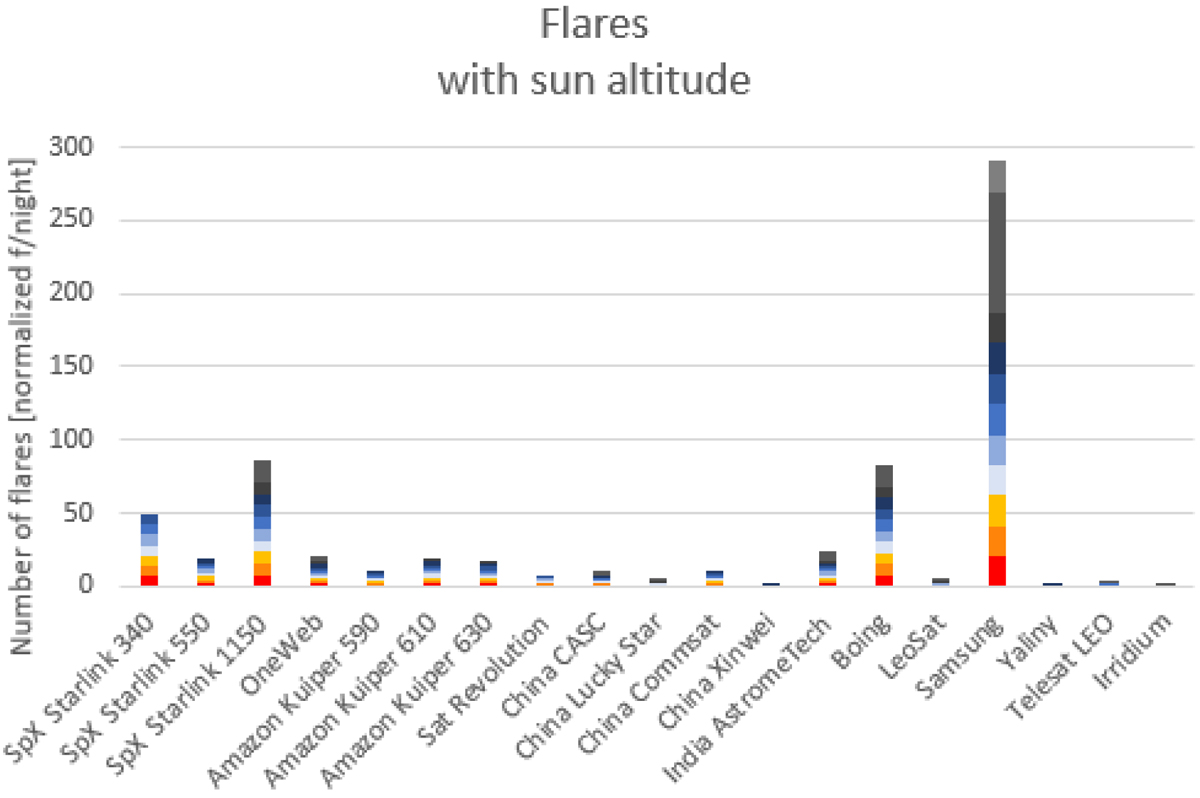
Number of flares for each constellation, simply scaling them to one-third of the flares caused by the original Iridium satellites (which had three large antennas) and to the number of satellites. This is the number of observable flares per night, or the number of flares per week brighter than −5 mag for a mid-latitude site. The colour encodes the sun elevation below the horizon, from 0° (red), −18° (pale blue), and into the night (darker blue to greys).
Current usage metrics show cumulative count of Article Views (full-text article views including HTML views, PDF and ePub downloads, according to the available data) and Abstracts Views on Vision4Press platform.
Data correspond to usage on the plateform after 2015. The current usage metrics is available 48-96 hours after online publication and is updated daily on week days.
Initial download of the metrics may take a while.