Free Access
Fig. 3.
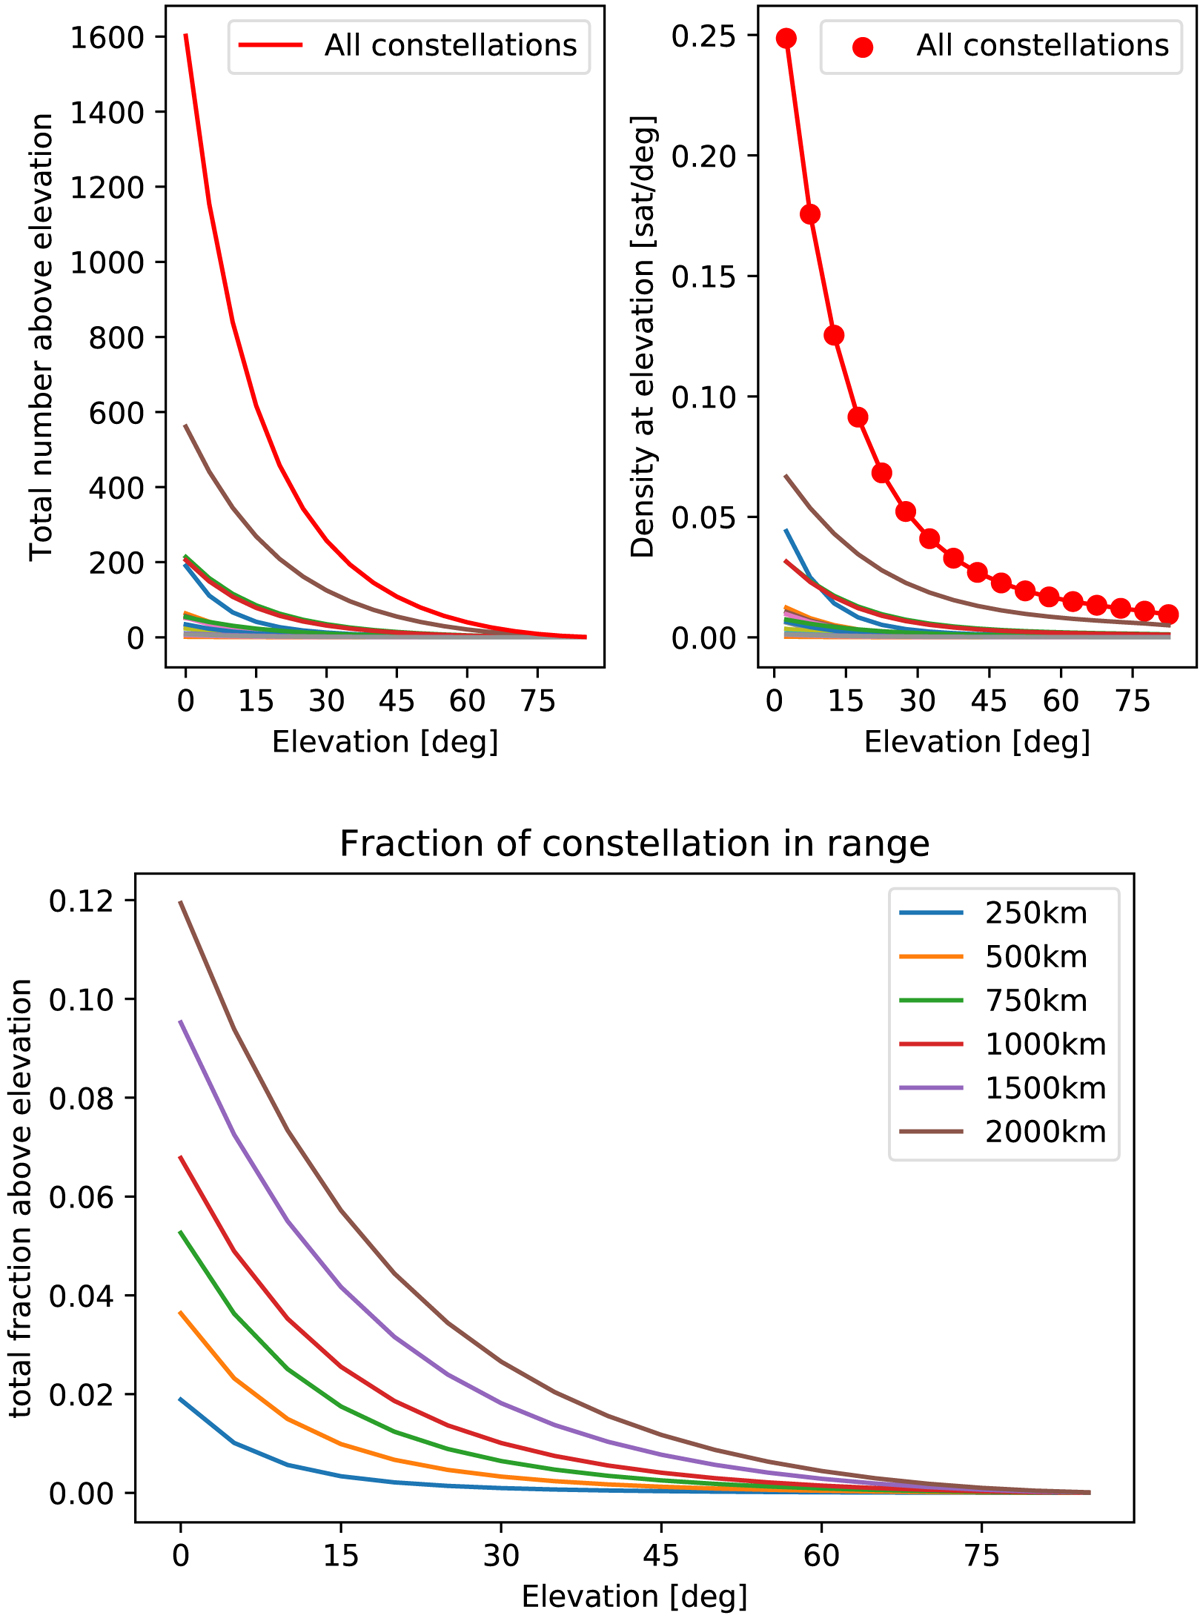
Top left: number of satellites above a given elevation; top right: corresponding density (in satellite per square degree) at a given elevation, for all the constellations considered. The total value is in red. Bottom: fraction of a constellation above a given elevation for a series of altitudes.
Current usage metrics show cumulative count of Article Views (full-text article views including HTML views, PDF and ePub downloads, according to the available data) and Abstracts Views on Vision4Press platform.
Data correspond to usage on the plateform after 2015. The current usage metrics is available 48-96 hours after online publication and is updated daily on week days.
Initial download of the metrics may take a while.