Fig. 9.
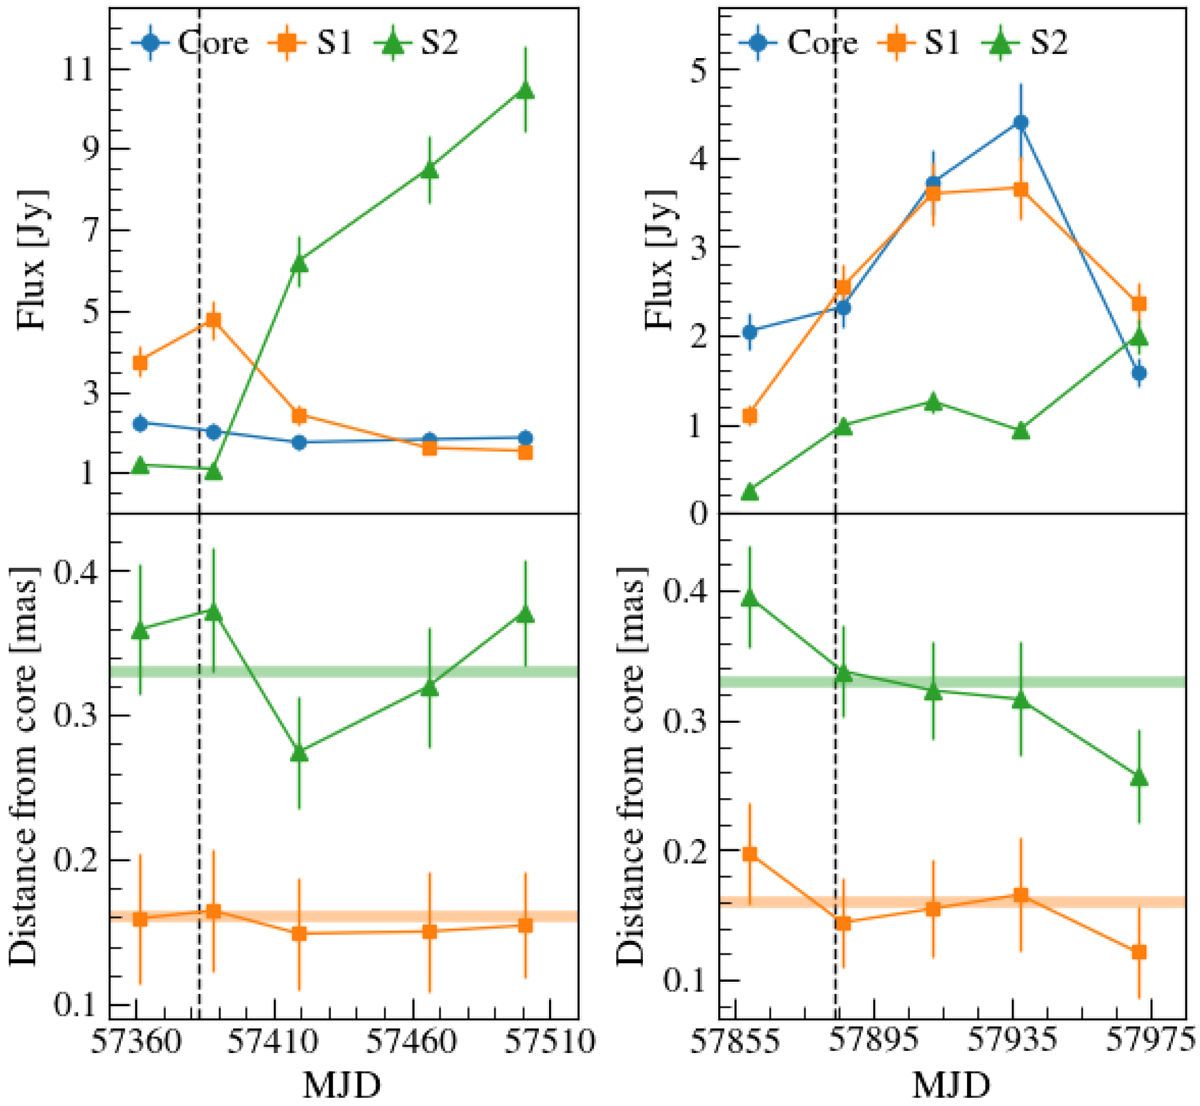
Left: flux density (top) and distance from the core (bottom) of the core, S1, and S2 derived from Gaussian modeling of the jet components as shown in Fig. 7. Right: same as the left panels, but for the observations in Fig. 8. The vertical dashed lines correspond to the times of the 2016 and 2017 γ-ray outbursts. The average distances of S1 and S2 (i.e., 0.16 and 0.33 mas from the core) are indicated by the horizontal solid lines.
Current usage metrics show cumulative count of Article Views (full-text article views including HTML views, PDF and ePub downloads, according to the available data) and Abstracts Views on Vision4Press platform.
Data correspond to usage on the plateform after 2015. The current usage metrics is available 48-96 hours after online publication and is updated daily on week days.
Initial download of the metrics may take a while.