Fig. 7.
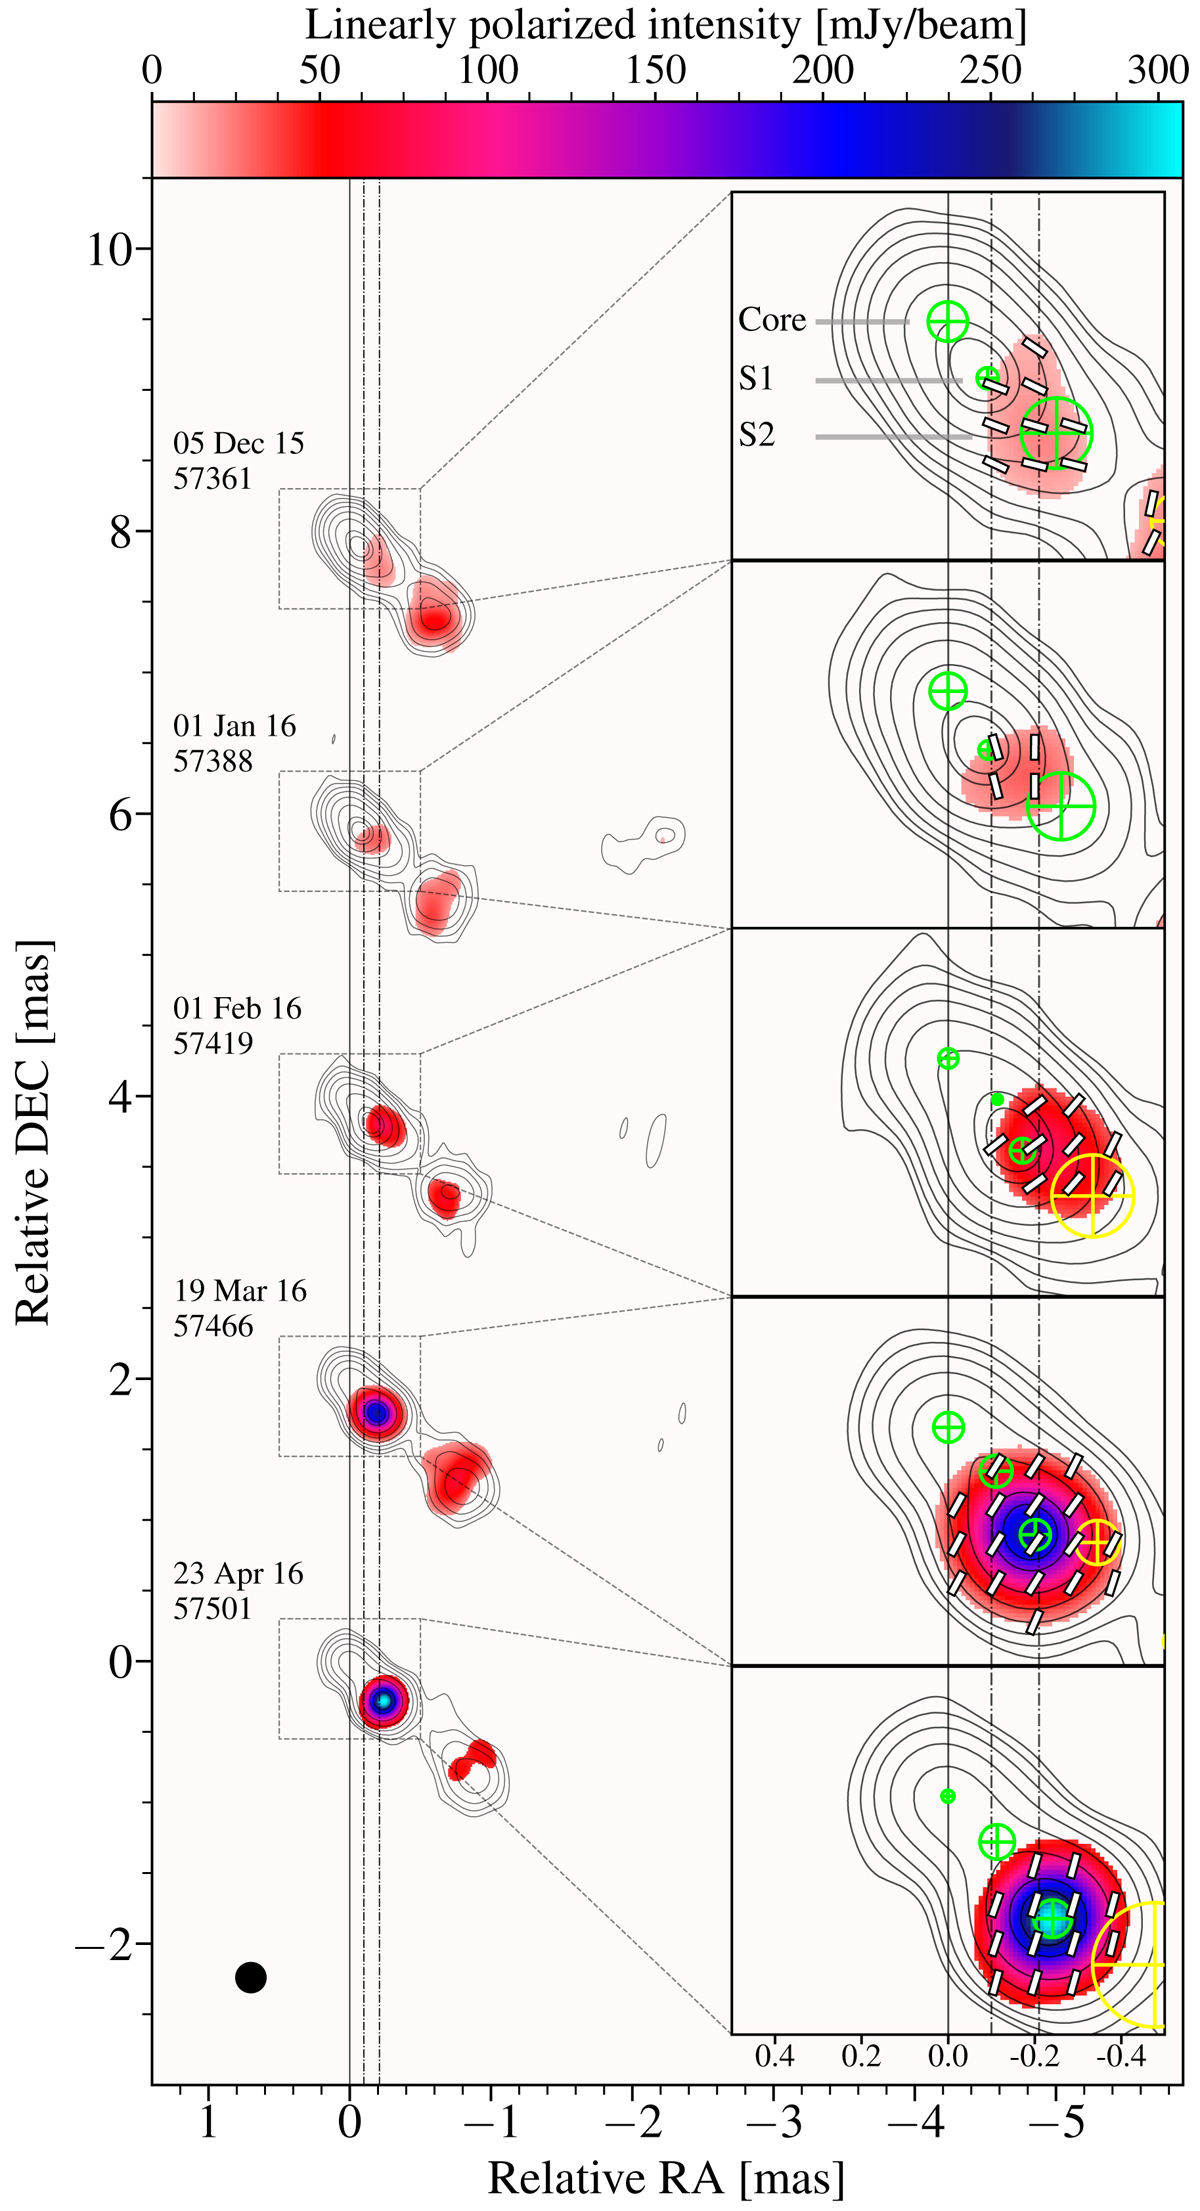
7 mm VLBA images of 3C 273 during the 2016 γ-ray outburst. The contours and color scale represent the total intensity and linearly polarized intensity, respectively. Contour levels are 1%, 2%, 4%, 8%, etc., 64%, 80% of the peak intensity. A zoomed-in view on the core region is provided in the subplots. White line segments indicate the EVPA directions uncorrected for Faraday rotation. Circular Gaussian jet components are indicated by green (for the three stationary components) and yellow (for the others) cirles with a cross. The vertical dot-dashed lines show the average positions of the S1 (=0.1 mas) and S2 (=0.21 mas) components projected onto the x-axis. The vertical solid line indicates the core position. All maps are restored with a 0.2 × 0.2 mas beam (indicated at the bottom left).
Current usage metrics show cumulative count of Article Views (full-text article views including HTML views, PDF and ePub downloads, according to the available data) and Abstracts Views on Vision4Press platform.
Data correspond to usage on the plateform after 2015. The current usage metrics is available 48-96 hours after online publication and is updated daily on week days.
Initial download of the metrics may take a while.