Fig. 5.
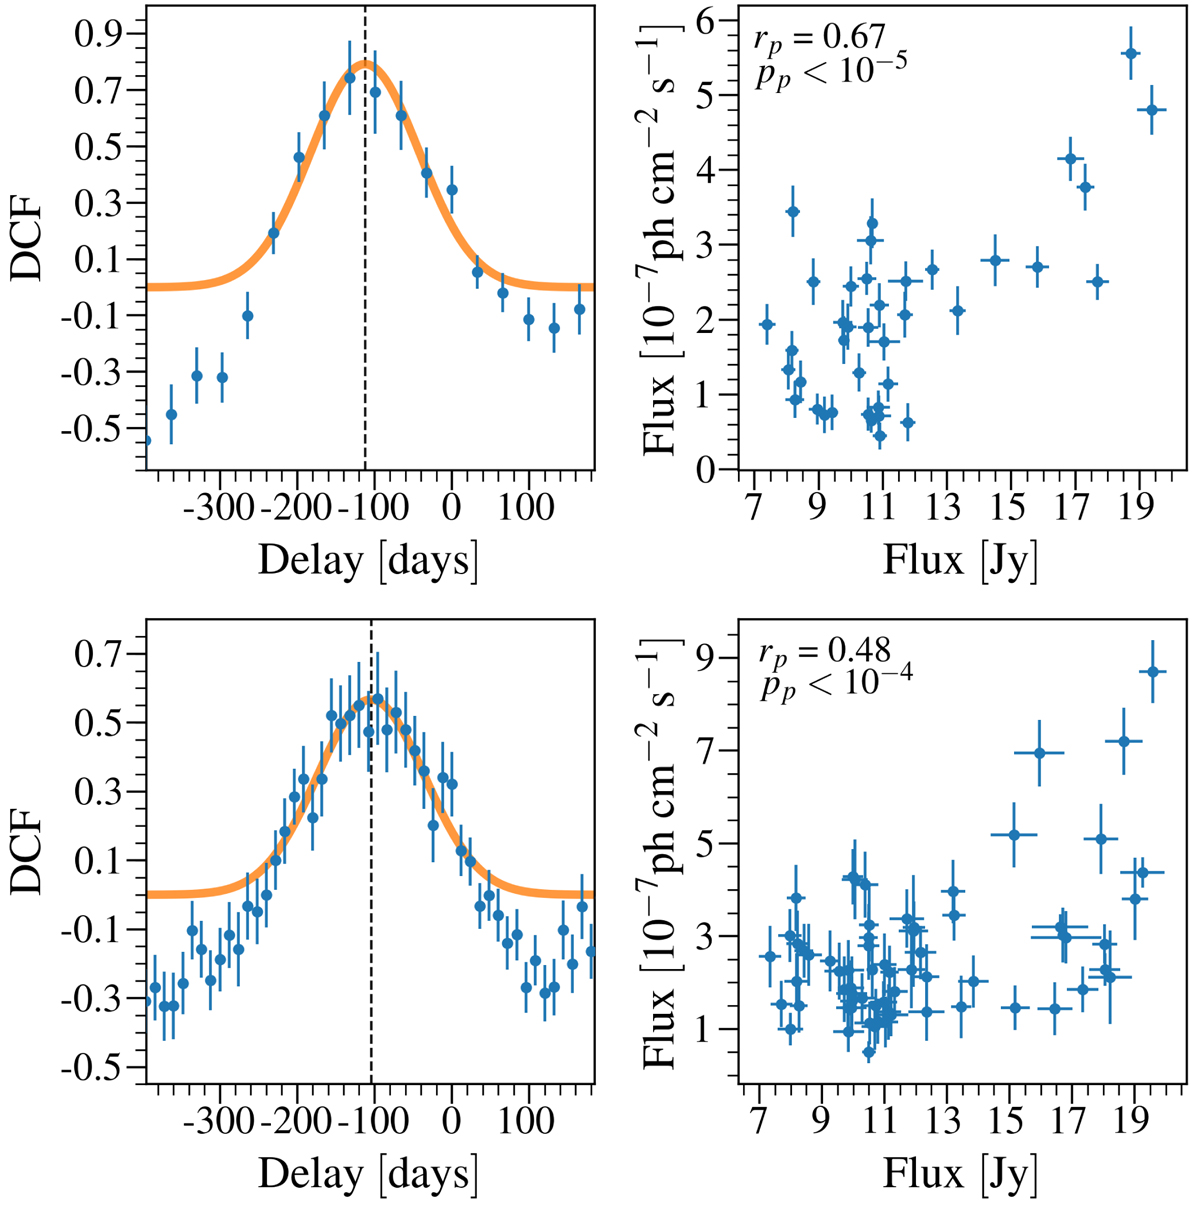
DCF curves and flux–flux plots comparing the 3 mm radio and γ-ray light curves in 2015−2019 for the monthly γ-ray fluxes (top panels) and the weekly γ-ray fluxes (bottom panels). Orange curves in the left panels indicate the best Gaussian fits to the DCF curves. For the flux-flux plots (right panels), the ALMA light curve has been shifted in time by the delays found from the Gaussian fits. The Pearson correlation coefficients (rp) and corresponding p-values (pp) are shown in the flux-flux plots.
Current usage metrics show cumulative count of Article Views (full-text article views including HTML views, PDF and ePub downloads, according to the available data) and Abstracts Views on Vision4Press platform.
Data correspond to usage on the plateform after 2015. The current usage metrics is available 48-96 hours after online publication and is updated daily on week days.
Initial download of the metrics may take a while.