Fig. 2.
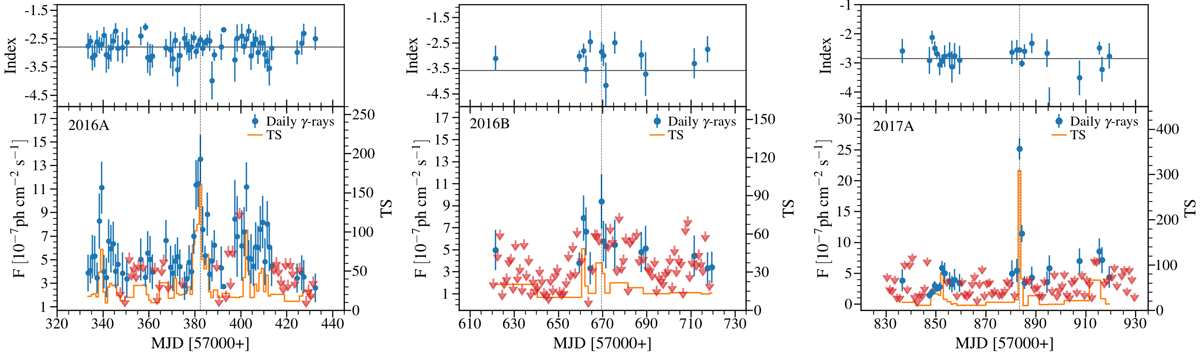
Zoomed-in γ-ray light curves of 3C 273, binned into one-day time bins, for the three γ-ray flaring periods indicated by the shaded areas in Fig. 1. Upper panels, in each diagram: photon indices at the same time resolution. Average photon index values are marked by horizontal solid lines. The vertical dashed lines mark the peak times of the γ-ray outbursts in the daily light curves.
Current usage metrics show cumulative count of Article Views (full-text article views including HTML views, PDF and ePub downloads, according to the available data) and Abstracts Views on Vision4Press platform.
Data correspond to usage on the plateform after 2015. The current usage metrics is available 48-96 hours after online publication and is updated daily on week days.
Initial download of the metrics may take a while.