Free Access
Fig. 11.
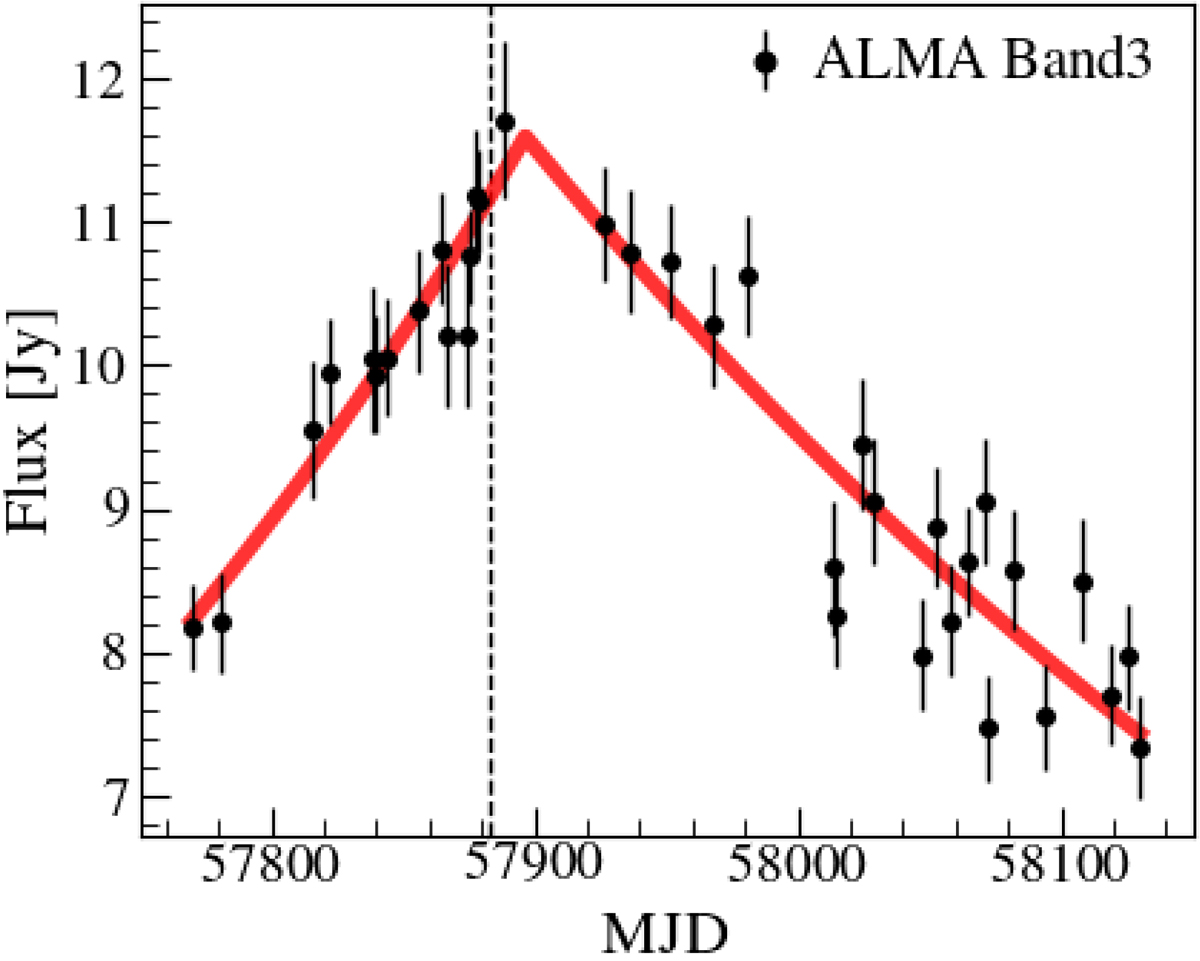
3 mm ALMA light curve around the time of the 2017 γ-ray outburst (vertical dashed line). The model that combines an exponential rise with a subsequent exponential decay (as introduced by Valtaoja et al. 1999, but without fixing the decay timescale) is indicated by the red curve.
Current usage metrics show cumulative count of Article Views (full-text article views including HTML views, PDF and ePub downloads, according to the available data) and Abstracts Views on Vision4Press platform.
Data correspond to usage on the plateform after 2015. The current usage metrics is available 48-96 hours after online publication and is updated daily on week days.
Initial download of the metrics may take a while.