Fig. 1.
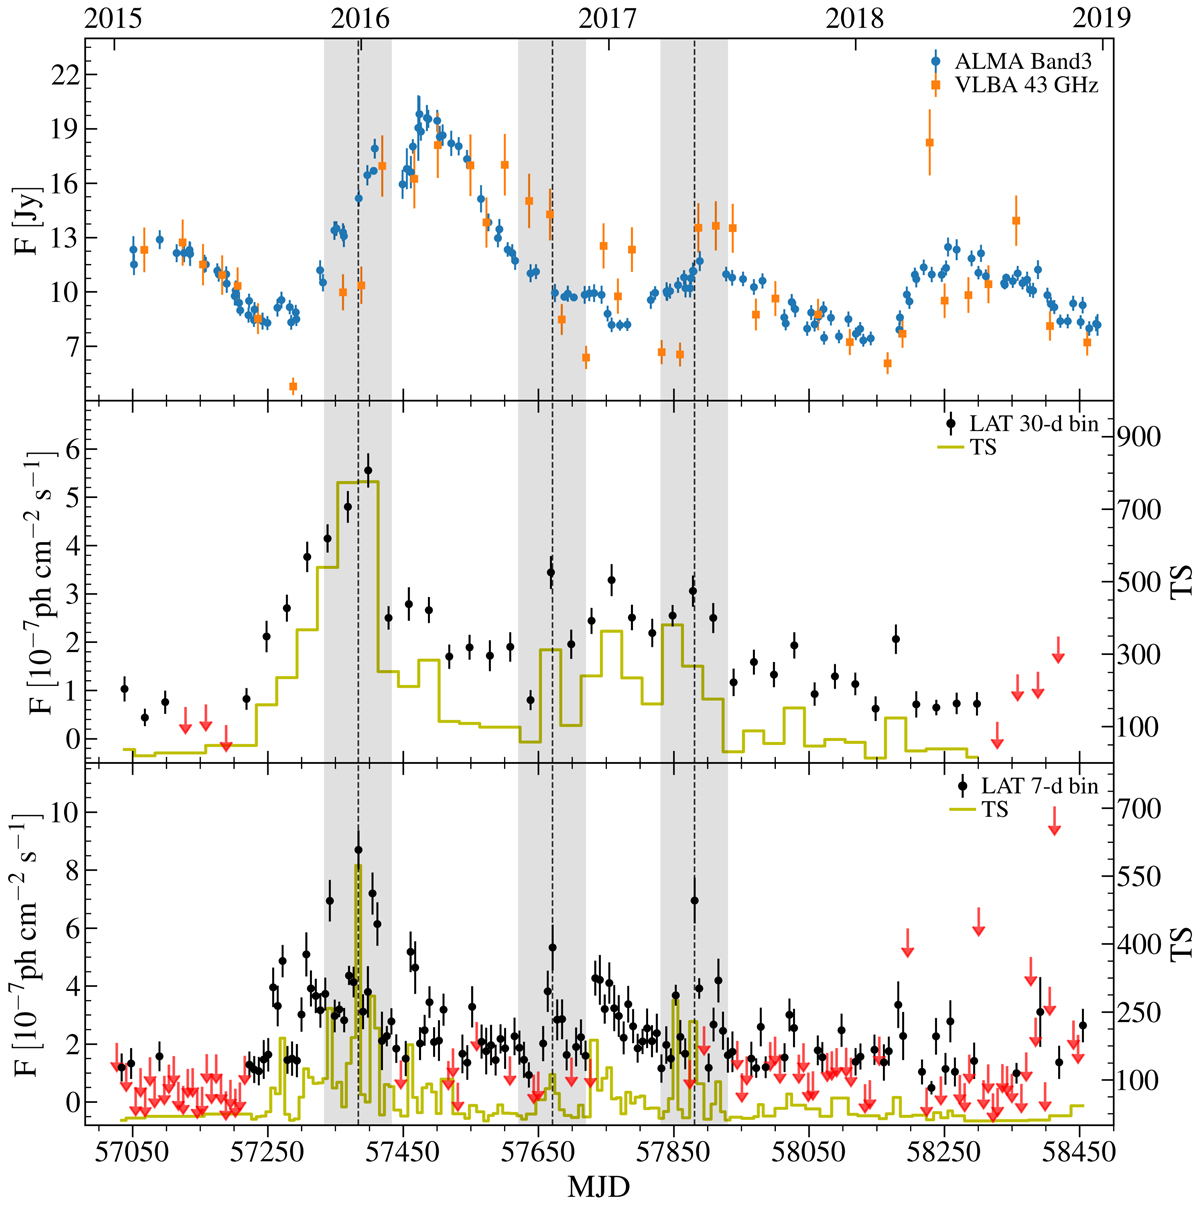
γ-ray and radio light curves of 3C 273 in 2015−2019. From top to bottom: ALMA band 3 (∼100 GHz) overlaid on the VLBA 43 GHz total flux, Fermi-LAT fluxes using monthly binning, and Fermi-LAT fluxes using weekly binning. For the γ-ray light curves, the 2 σ upper limits are indicated by red downward arrows. The vertical dashed lines show three γ-ray outbursts that are identified in the weekly light curve. Each of the shaded areas spans 100 days centered at the peak of a γ-ray outburst.
Current usage metrics show cumulative count of Article Views (full-text article views including HTML views, PDF and ePub downloads, according to the available data) and Abstracts Views on Vision4Press platform.
Data correspond to usage on the plateform after 2015. The current usage metrics is available 48-96 hours after online publication and is updated daily on week days.
Initial download of the metrics may take a while.