Free Access
Fig. 10
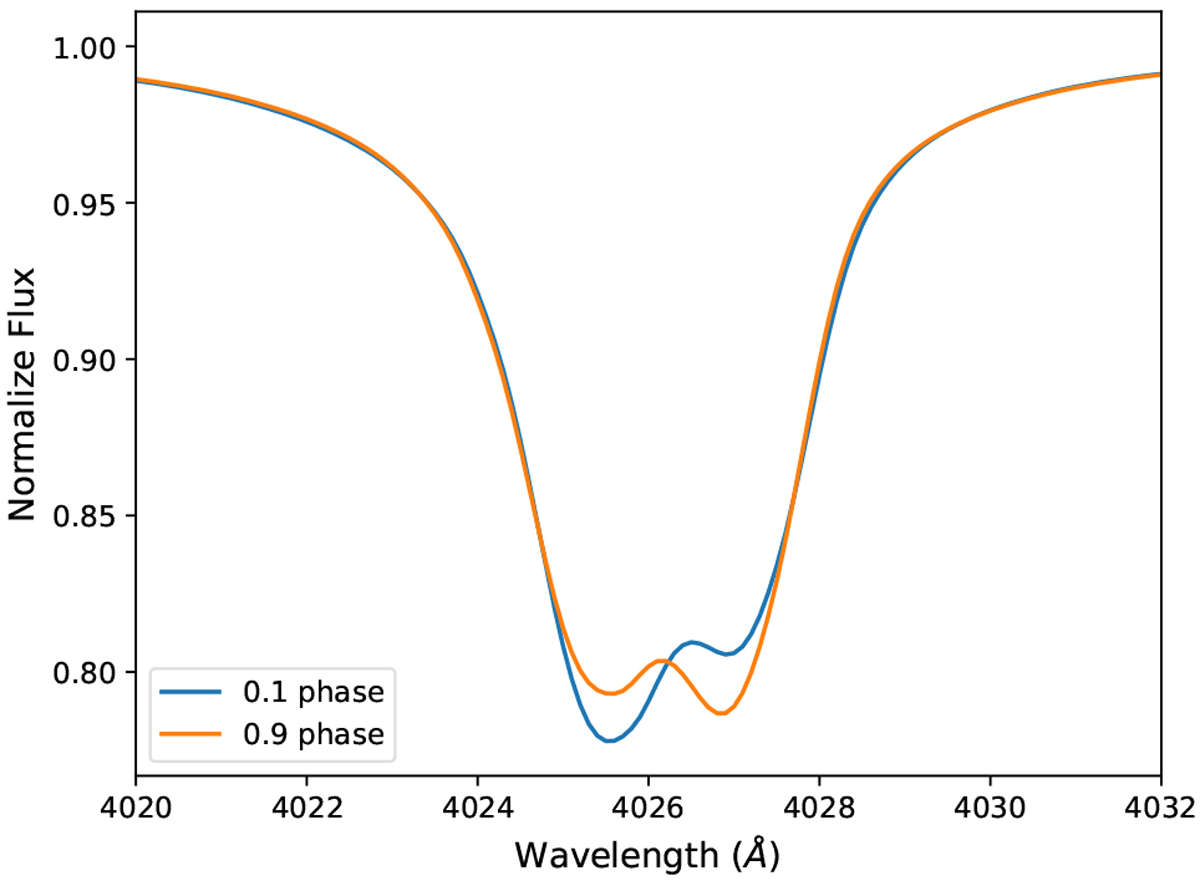
Example of the Struve-Sahade effect for a noneclipsing spectroscopic binary. The He I λ4026 line profile is plotted for the system at two different phases (0.1 plotted in blue and 0.9 plotted in orange) demonstrating the change in line strengths.
Current usage metrics show cumulative count of Article Views (full-text article views including HTML views, PDF and ePub downloads, according to the available data) and Abstracts Views on Vision4Press platform.
Data correspond to usage on the plateform after 2015. The current usage metrics is available 48-96 hours after online publication and is updated daily on week days.
Initial download of the metrics may take a while.