Fig. 9
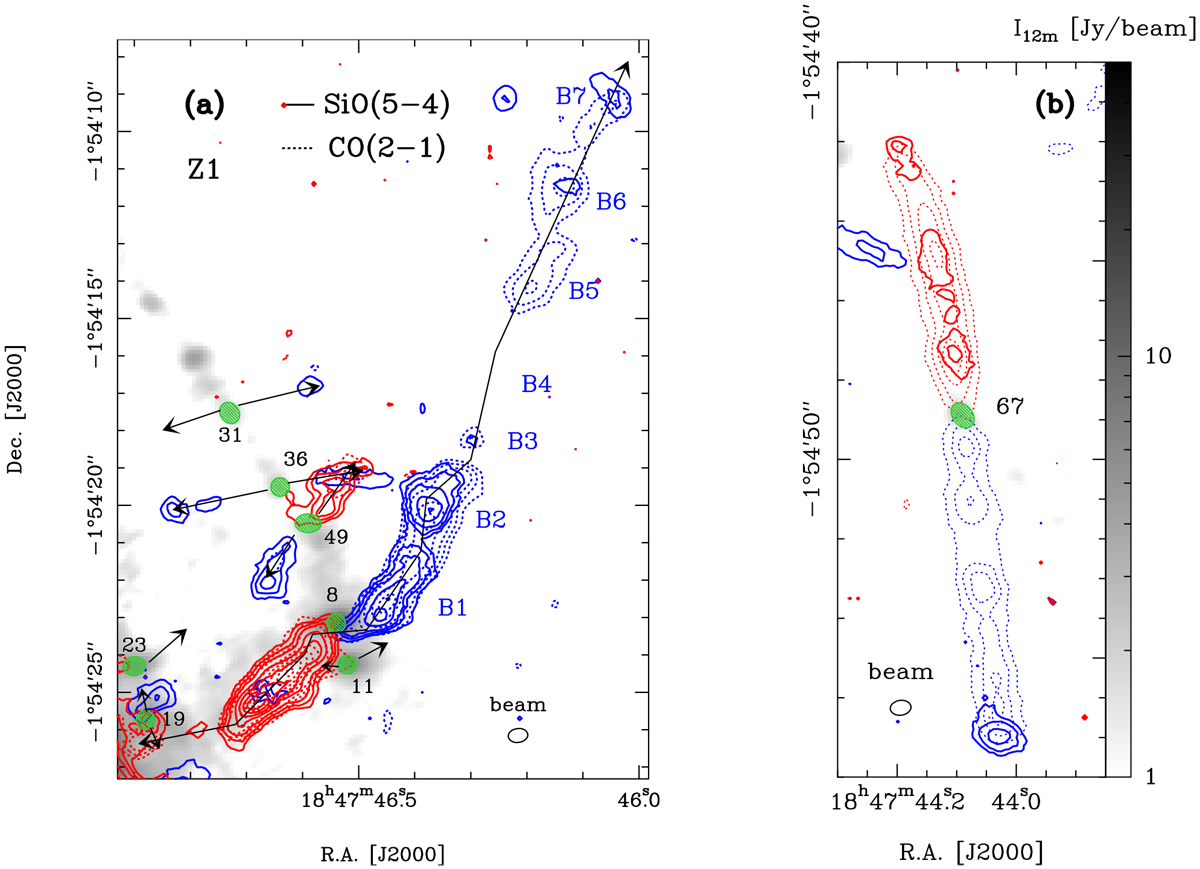
Molecular outflows observed in SiO(5–4) compared with their CO(2–1) emission in the central region (a, Z1 field ofFig. 3a) and in the surrounding of core #67 (b). The SiO line is integrated over 43− 93 km s−1 (continuous blue contours) and 103−153 km s−1 (continuous red contours), with contours of 6, 11, 18 to 198 by steps of 15 (a) and 5, 10, 20 (in b), in units of σSiO = 23 mJy beam−1 km s−1. The CO line is integrated over 21−64 km s−1 (dotted blue contours), with contours 7, 15, 30 to 270 by steps of 40 (a) and 5, 12, 19 (b), in units of σCO,B= 32 mJy beam−1 km s−1; and 128−158 km s−1 (dotted red contours), with contours of 7, 15, 30 to 280 by steps of 50 (a) and 5, 15, 30, 45 (b), in units of σCO,R= 22 mJy beam−1 km s−1. Contours are overlaid on the 1.3-mm continuum emission of the 12-m array (gray scale). Green ellipses locate the W43-MM1 cores, arrows (sometimes broken) indicate the direction of their outflows. Knots of the molecular outflow of core #8 arelabelled B1 to B7.
Current usage metrics show cumulative count of Article Views (full-text article views including HTML views, PDF and ePub downloads, according to the available data) and Abstracts Views on Vision4Press platform.
Data correspond to usage on the plateform after 2015. The current usage metrics is available 48-96 hours after online publication and is updated daily on week days.
Initial download of the metrics may take a while.