Fig. 8
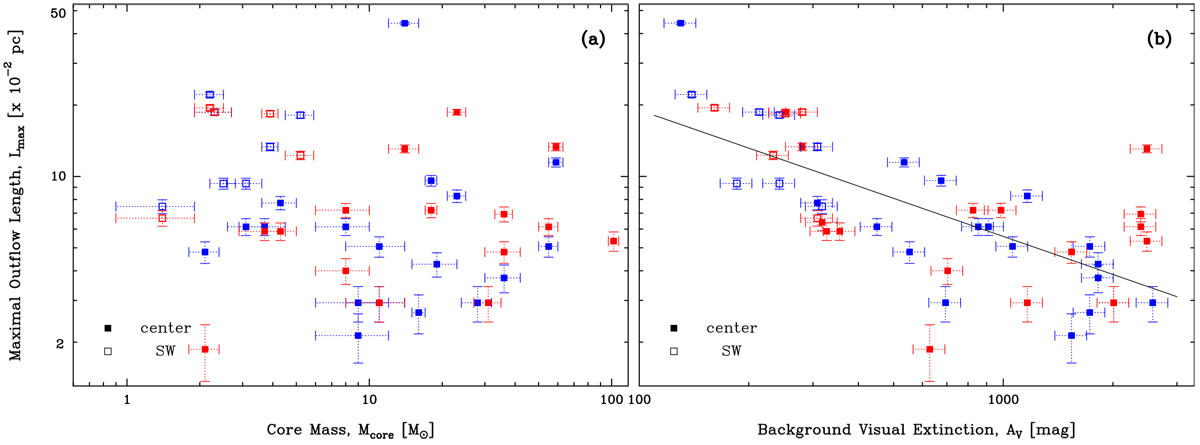
Maximal outflow length observed projected on the plane of the sky, Lmax, vs. the mass of the launching core, Mcore (a) and the visual extinction of the cloud background crossed by the outflow, AV (b). For the longest outflows, measurements at their tip (in parenthesis in Table 2) are used instead of that averaged over their complete extent. Filled and empty squares pinpoint outflow lobes developing in the central and south-western parts of W43-MM1, respectively. Blue and red colors show theblue- and red-shifted lobes, respectively. The anti-correlation found in (b) (best fit line ![]() with α = −0.5 ± 0.1) suggests that molecular outflows are shorter in denser environments.
with α = −0.5 ± 0.1) suggests that molecular outflows are shorter in denser environments.
Current usage metrics show cumulative count of Article Views (full-text article views including HTML views, PDF and ePub downloads, according to the available data) and Abstracts Views on Vision4Press platform.
Data correspond to usage on the plateform after 2015. The current usage metrics is available 48-96 hours after online publication and is updated daily on week days.
Initial download of the metrics may take a while.