Fig. 6
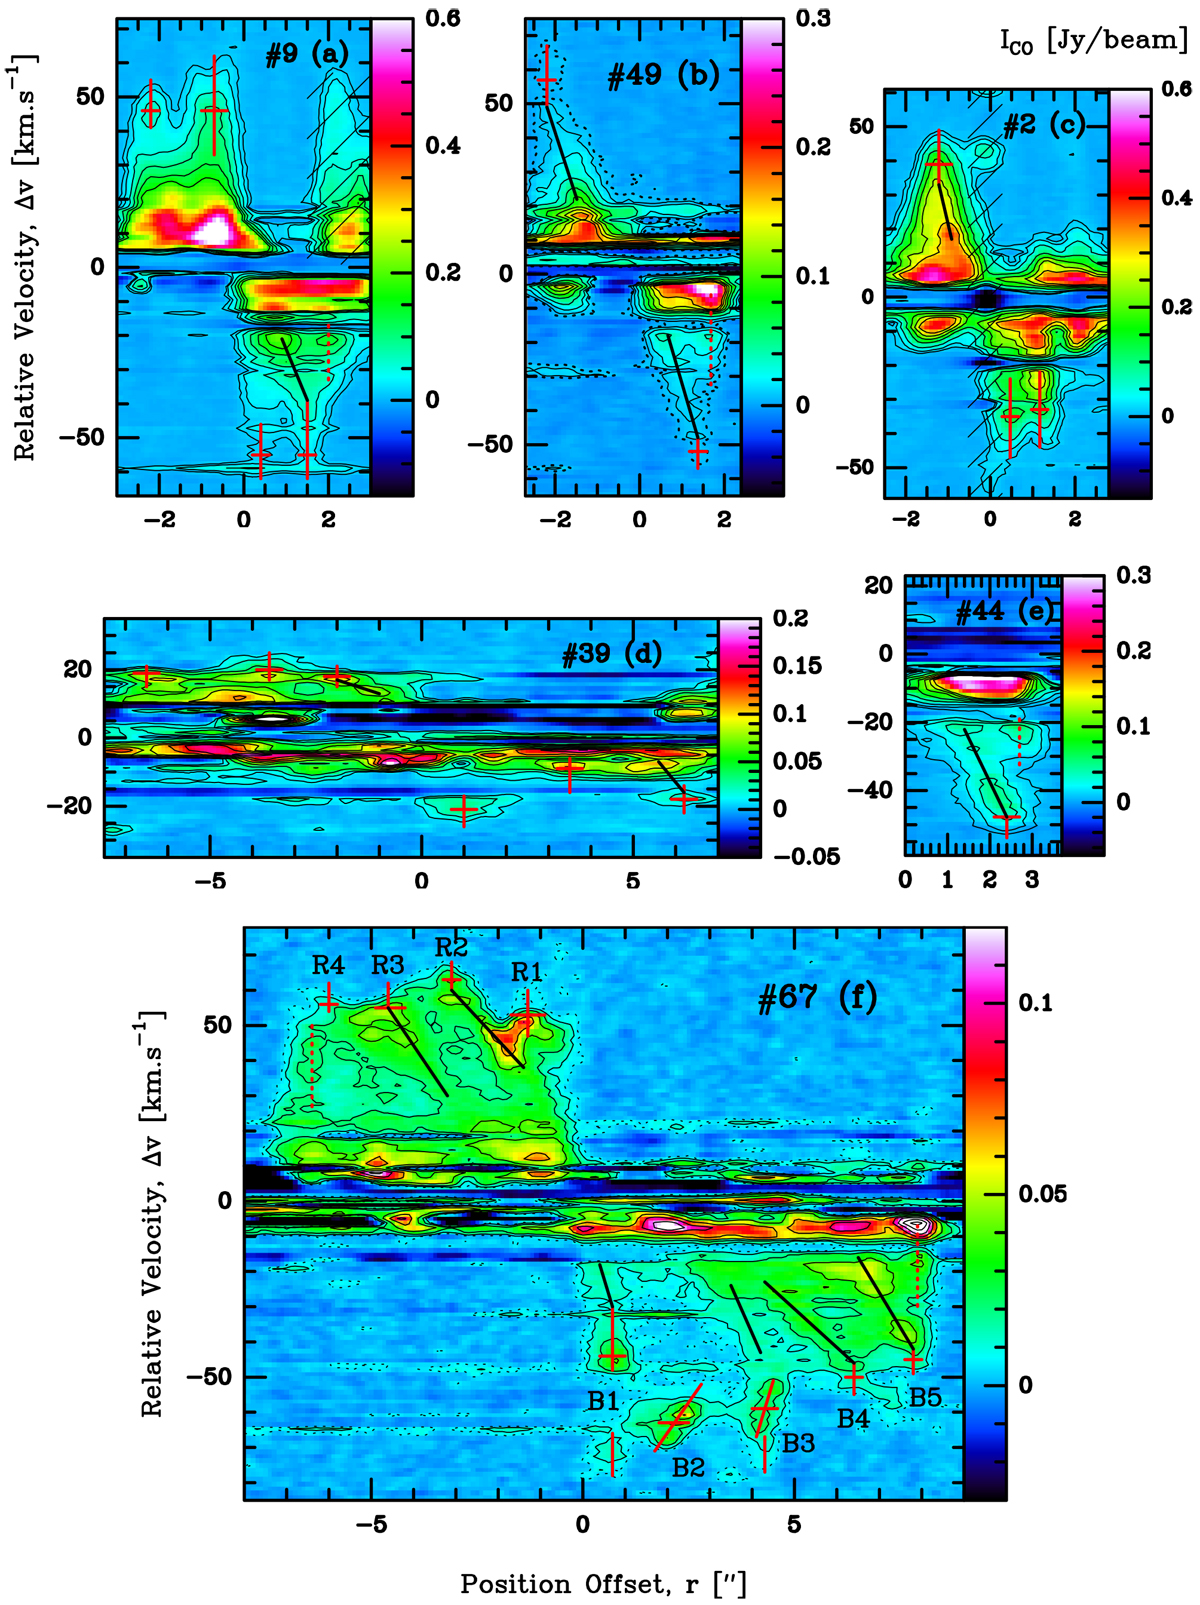
PV diagrams along the molecular outflows of cores #9 (a), #49 (b), #2 (c), #39 (d), #44 (e), and #67 (f). Same convention of position offsets, segments, and lines as in Fig. 5. Contours are 5, 10, 22 to 67 by steps of 15 in (a), 4, 8, 15 to 65 by steps of 10 in (b) and (d–f), 5, 10, 22 to 122 by steps of 25 in (c), in units of σCO =2.5 mJy beam−1. Additional 2σCO contours aredrawn in dotted line in (b) and (f) to highlight weaker emission. PV areas confused by another outflow in (a) and hot core lines in (c) are hatched.
Current usage metrics show cumulative count of Article Views (full-text article views including HTML views, PDF and ePub downloads, according to the available data) and Abstracts Views on Vision4Press platform.
Data correspond to usage on the plateform after 2015. The current usage metrics is available 48-96 hours after online publication and is updated daily on week days.
Initial download of the metrics may take a while.