Fig. 5
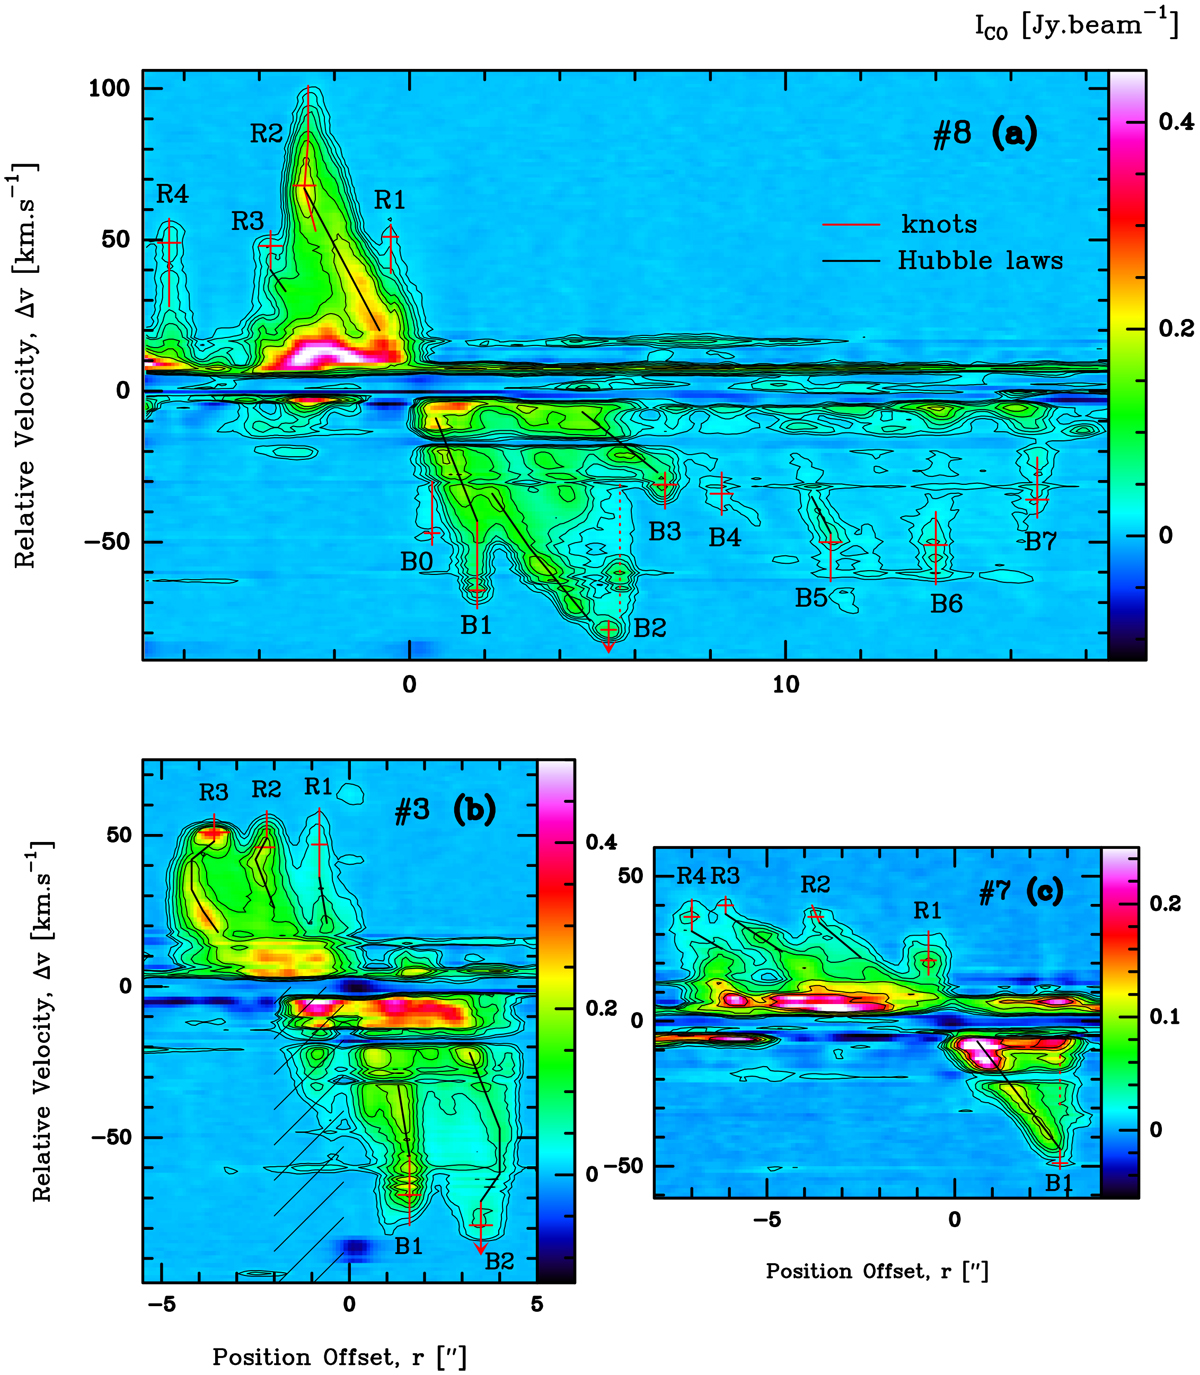
PV diagrams along molecular outflows of cores #8 (a), #3 (b), and #7 (c). Position offsets, r on the X-axis, are given with respect to the core center or the connecting point between the red and blue lobes. Negative and positive position offsets correspond to the red and blue lobes, respectively. Each figure has the same physical scales on the X-axis and on the Y -axis. Contours are 5, 10, 22 to 67 by 15 steps in units of σCO = 2.5 mJy beam−1. Additional 16σCO contours are drawn in (a) and (c). Vertical and horizontal segments in red locate the detected knots (at rknot in Table 3) and outline their associated velocity range from which Vknot was measured. Segments with arrows in (a) and (b) indicate the knots whose velocity range is limited by absorption features. Fingers, with Hubble-law gas distributions connecting the knots with lower velocity structures, are indicated with continuous black lines, gas layers possibly associated with lateral forward shocks are indicated with dotted red lines. The PV area confused by another outflow is hatched in (b).
Current usage metrics show cumulative count of Article Views (full-text article views including HTML views, PDF and ePub downloads, according to the available data) and Abstracts Views on Vision4Press platform.
Data correspond to usage on the plateform after 2015. The current usage metrics is available 48-96 hours after online publication and is updated daily on week days.
Initial download of the metrics may take a while.