Fig. A.3
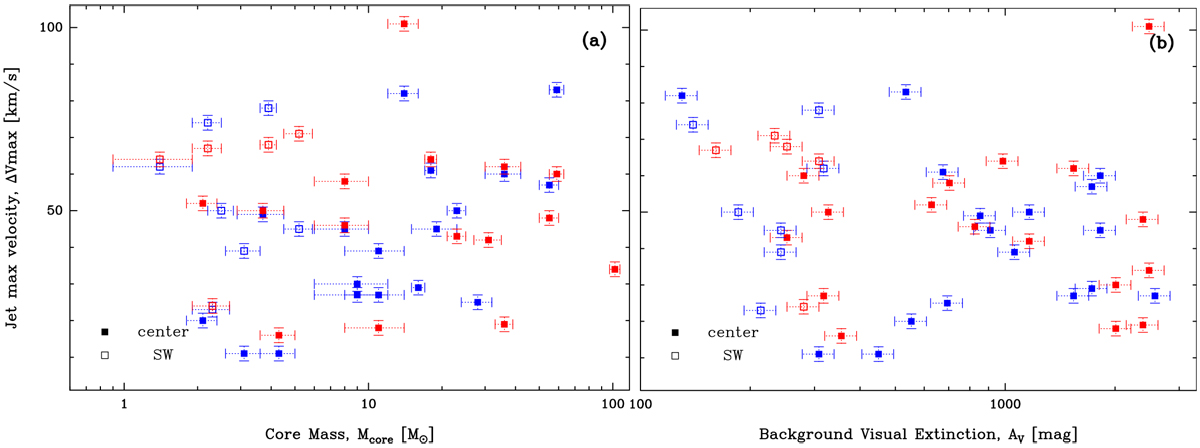
Jet maximal velocity, ΔVmax vs. mass of the launching core, Mcore, (a) and the visual extinction of the cloud background crossed by the outflow, AV, (b). Filled and empty squares pinpoint outflow lobes developing in the central and south-western part of W43-MM1, respectively.Blue and red colors show the blue- and red-shifted lobes, respectively. No clear correlation is revealed.
Current usage metrics show cumulative count of Article Views (full-text article views including HTML views, PDF and ePub downloads, according to the available data) and Abstracts Views on Vision4Press platform.
Data correspond to usage on the plateform after 2015. The current usage metrics is available 48-96 hours after online publication and is updated daily on week days.
Initial download of the metrics may take a while.