Open Access
Fig. A.1
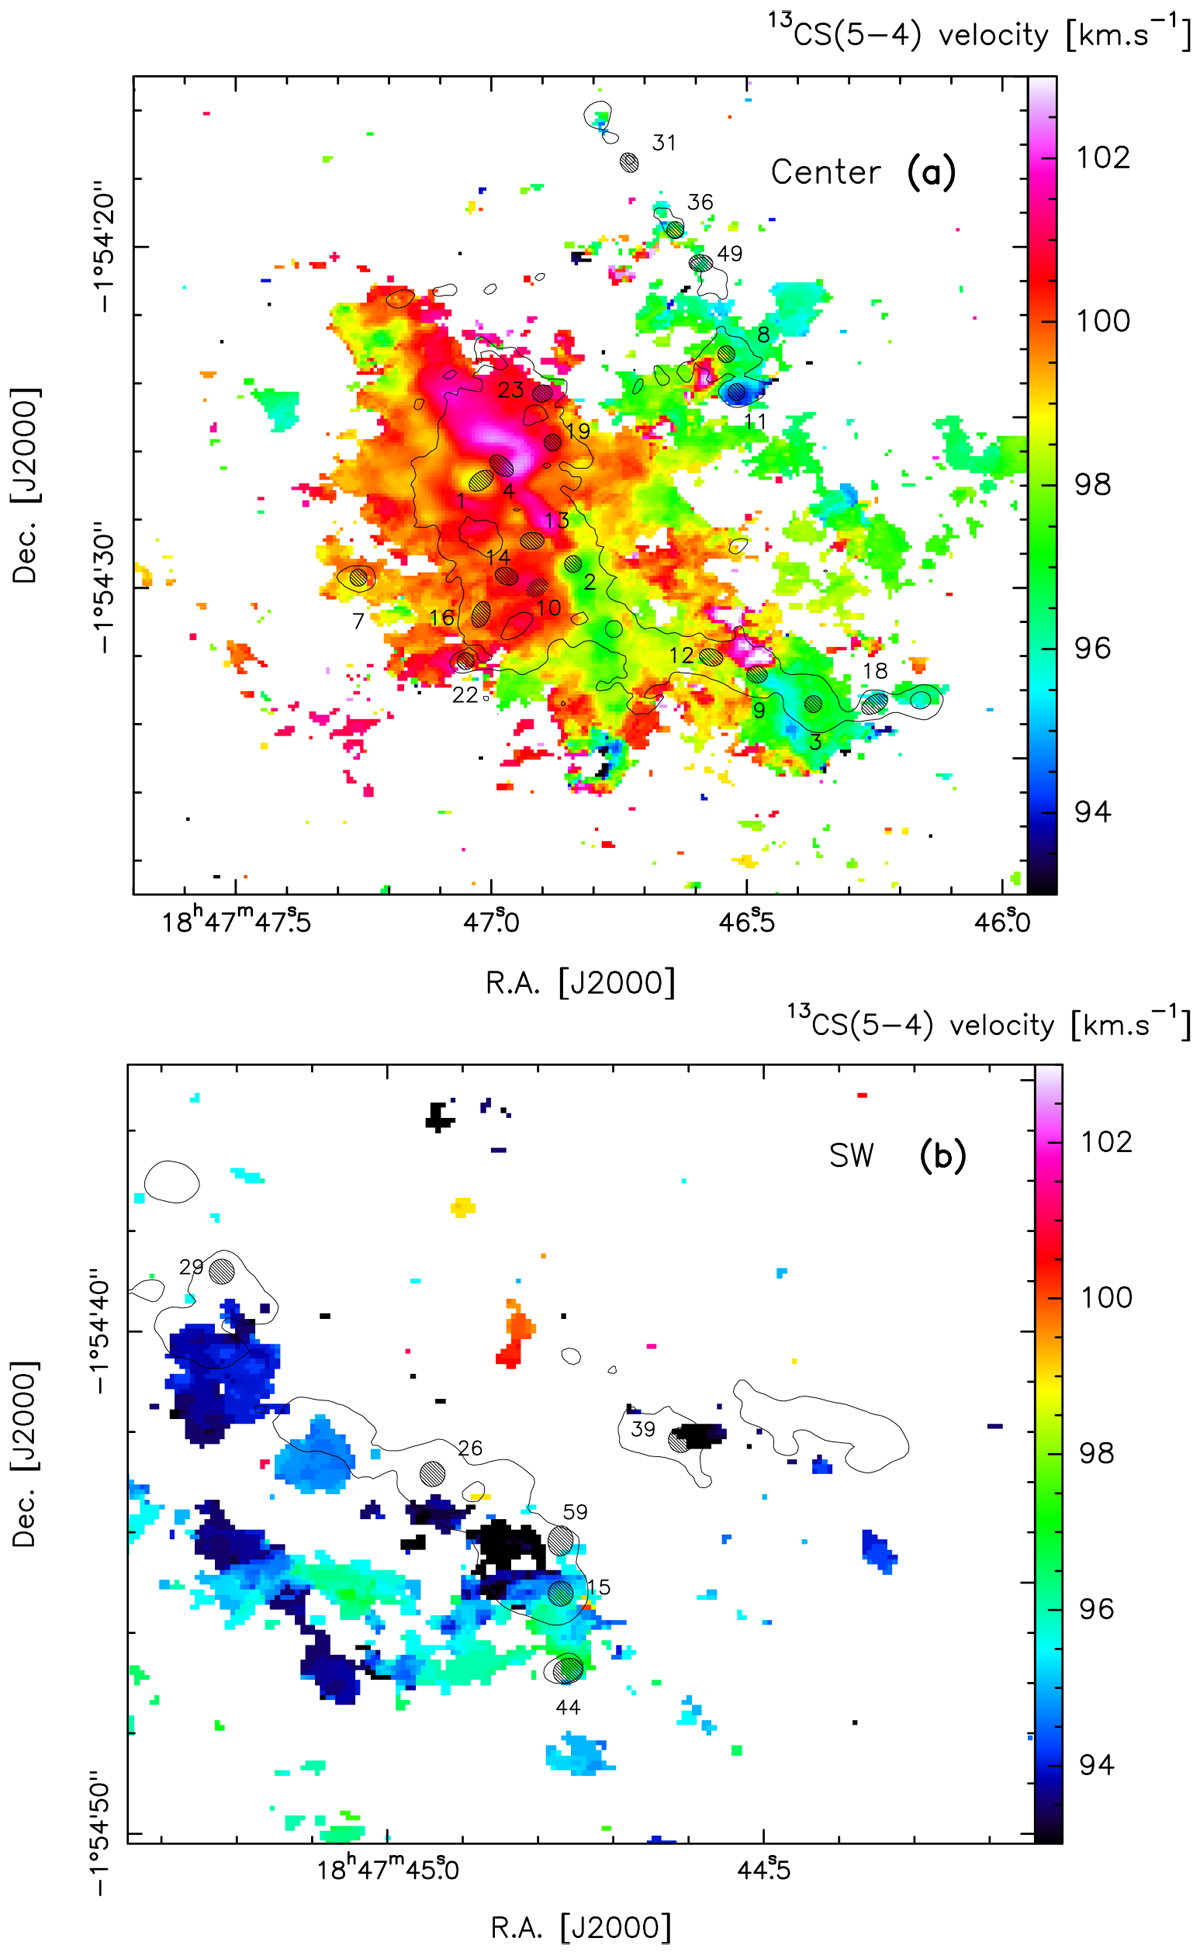
Moment 1 – velocity field – map of 13CS(5–4) line in the central region (a) and the south-western region (b). Hatched ellipses locate the cores with detected molecular outflows, black contours at 3 mJy beam−1 (a), and 7 mJy beam−1 (b) outline the continuum 1.3-mm emission of the 12-m array.
Current usage metrics show cumulative count of Article Views (full-text article views including HTML views, PDF and ePub downloads, according to the available data) and Abstracts Views on Vision4Press platform.
Data correspond to usage on the plateform after 2015. The current usage metrics is available 48-96 hours after online publication and is updated daily on week days.
Initial download of the metrics may take a while.