Fig. 11
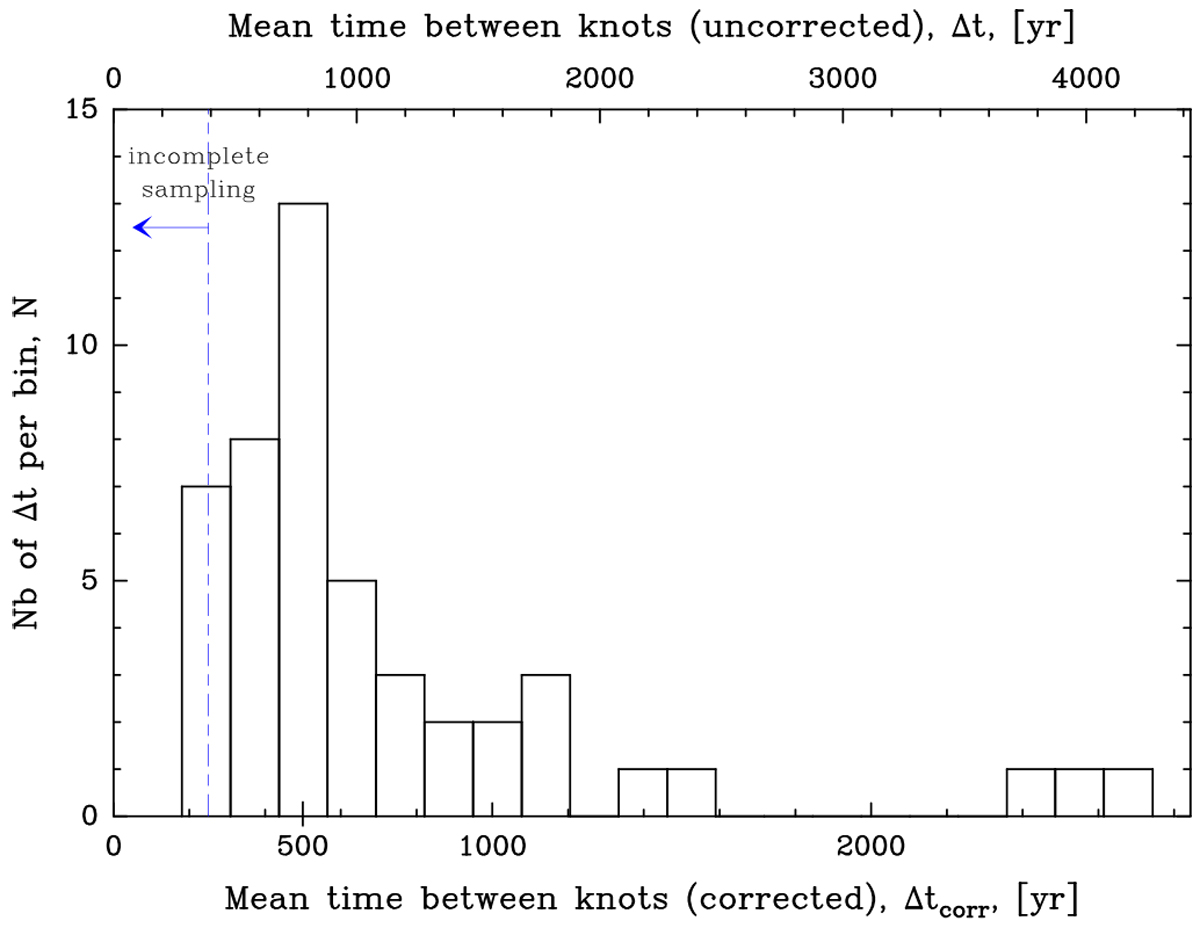
Distribution of timescale differences between successive ejection events. The top and bottom axes show the timescales before and after the correction by a homogeneous inclination angle of 57.3°, Δtcorr, and Δt, respectively. The 75% completeness limit, ~250 yr after deprojection, is represented by a dashed line. Outflows display a variability with a typical timescale, corrected for projection effects, of ![]() yr.
yr.
Current usage metrics show cumulative count of Article Views (full-text article views including HTML views, PDF and ePub downloads, according to the available data) and Abstracts Views on Vision4Press platform.
Data correspond to usage on the plateform after 2015. The current usage metrics is available 48-96 hours after online publication and is updated daily on week days.
Initial download of the metrics may take a while.