Fig. 10
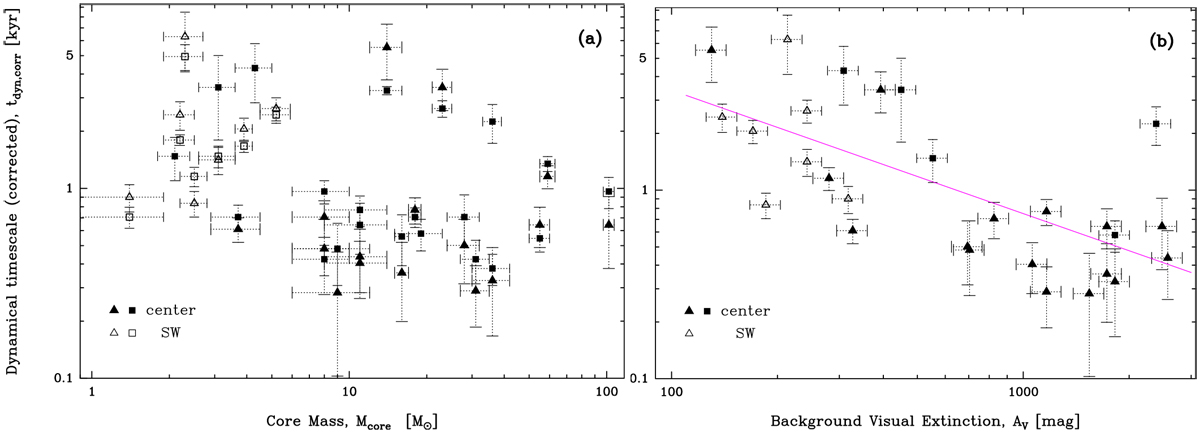
Outflow dynamical timescale corrected for a mean projection angle of 57.3°, tdyn, corr, vs. mass of the launching core, Mcore (a) and the visual extinction of the cloud background crossed by the outflow, AV (b). The dynamical timescale of a given core is evaluated in two ways: as the oldest ejection event (triangles) and as the Lmax ∕ΔVmax ratio (squares). Both dynamical timescales are plotted in (a), showing that they are generally consistent within errorbars. A single estimate is used in (b), which corresponds to the oldest ejection event (triangles) when it can be measured and the Lmax ∕ΔVmax ratio otherwise (squares). No significant correlation is observed in (a). The anti-correlation between tdyn and AV in (b), ![]() with α = −0.7 ± 0.1 (magenta line) and a Pearson correlation coefficient of −0.67, is reminiscent of that between Lmax
and AV in Fig. 8b.
with α = −0.7 ± 0.1 (magenta line) and a Pearson correlation coefficient of −0.67, is reminiscent of that between Lmax
and AV in Fig. 8b.
Current usage metrics show cumulative count of Article Views (full-text article views including HTML views, PDF and ePub downloads, according to the available data) and Abstracts Views on Vision4Press platform.
Data correspond to usage on the plateform after 2015. The current usage metrics is available 48-96 hours after online publication and is updated daily on week days.
Initial download of the metrics may take a while.