Fig. 2
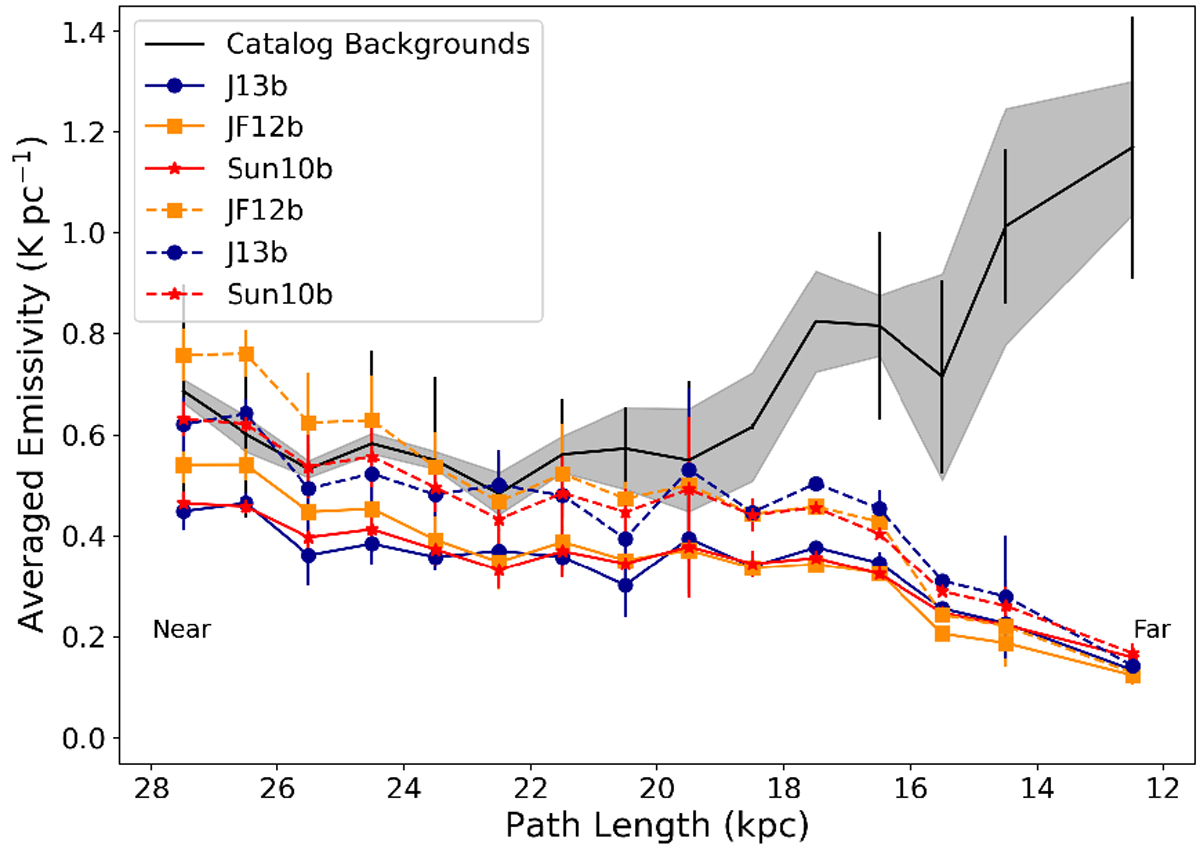
Averaged background emissivity (K pc−1) as a function of the path length (kpc) from the considered HII region to the far boundary of the Galaxy. The catalog data are shown in black, with error margins in gray. This margin consists of the propagated measurement error for the data points in the bin. Also shown is the standard deviation, σ, in the observations as black error bars. The simulated values for two different CRE models are shown for the three different GMF models J13b, JF12b, and Sun10b. The solid line indicates the results for the z10LMPDE CRE model and the dashed line indicates the results for the 71Xvarh7S CRE model. All data – both simulated and catalog values – are averaged into bins with 1 kpc width. The standard deviation for the GMF models is calculated per bin and is plotted.
Current usage metrics show cumulative count of Article Views (full-text article views including HTML views, PDF and ePub downloads, according to the available data) and Abstracts Views on Vision4Press platform.
Data correspond to usage on the plateform after 2015. The current usage metrics is available 48-96 hours after online publication and is updated daily on week days.
Initial download of the metrics may take a while.