Fig. 11.
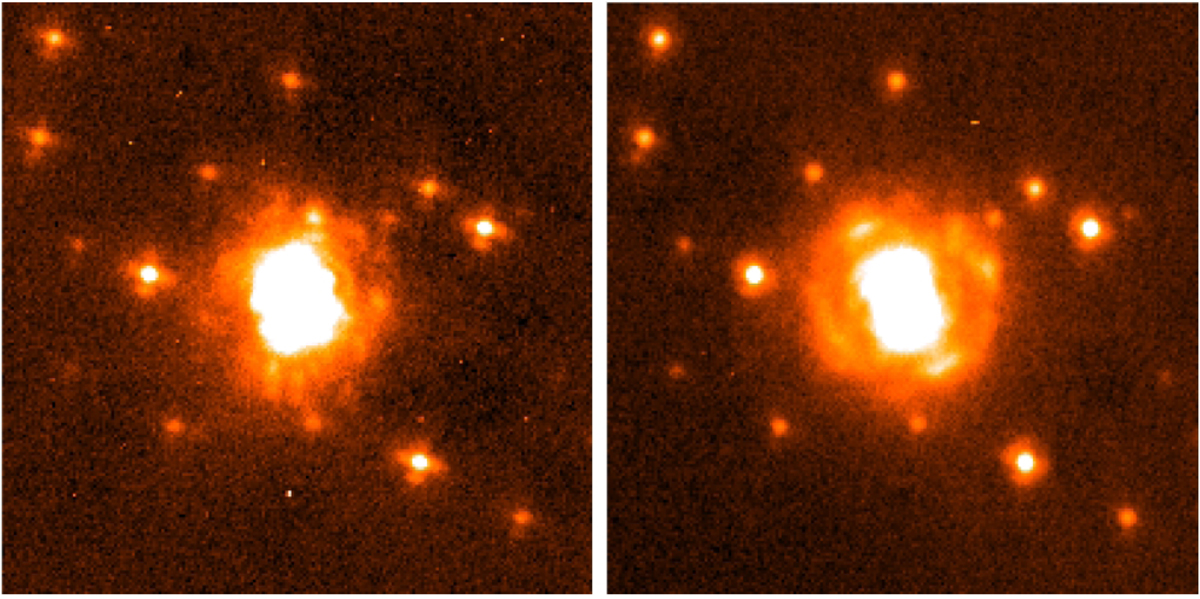
Example of NCPA correction for an AO observation of Palomar10 globular cluster. We compare a subfield of 3″ × 3″ on the LUCI2 N30 frames with (right) and without (left) NCPA correction. The images clearly show the improvement in PSF quality. The images are Ks band with total exposure time of 105 s and 960 s for left and right, respectively.
Current usage metrics show cumulative count of Article Views (full-text article views including HTML views, PDF and ePub downloads, according to the available data) and Abstracts Views on Vision4Press platform.
Data correspond to usage on the plateform after 2015. The current usage metrics is available 48-96 hours after online publication and is updated daily on week days.
Initial download of the metrics may take a while.