Fig. 3.
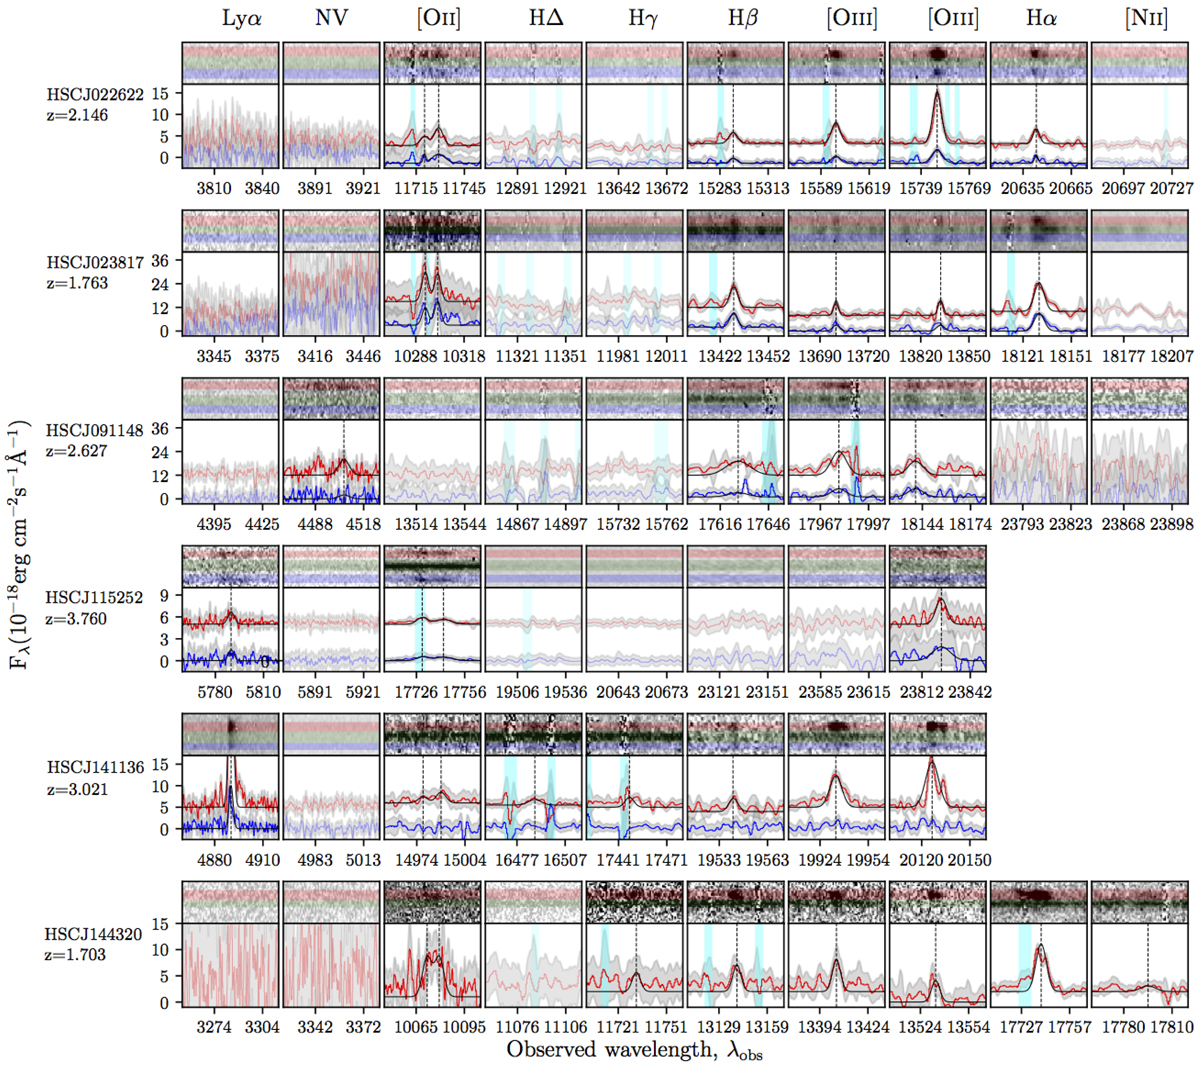
Upper panel in each row: small cutouts of the 2D spectrum with three shaded regions (red, green, blue) which correspond to the apertures for 1D spectra extraction of lensed source, lens galaxy, and lensed counterpart, respectively. The stacked 1D spectrum of the X-shooter lensed source and its counterpart are shown with red and blue lines, respectively, in the lower panel, with corresponding emission lines marked by the vertical dashed lines and labeled above the panels. The errors on the spectrum are shown with a shaded region (gray). The black lines show Gaussian fits to the emission lines. The vertical shaded region (cyan) shown in all panels indicates absorption features due to telluric contamination. The semi-transparent panels show the locations of common emission lines that are not detected for the given source redshift. The unit of wavelength is angstroms.
Current usage metrics show cumulative count of Article Views (full-text article views including HTML views, PDF and ePub downloads, according to the available data) and Abstracts Views on Vision4Press platform.
Data correspond to usage on the plateform after 2015. The current usage metrics is available 48-96 hours after online publication and is updated daily on week days.
Initial download of the metrics may take a while.