Fig. 2.
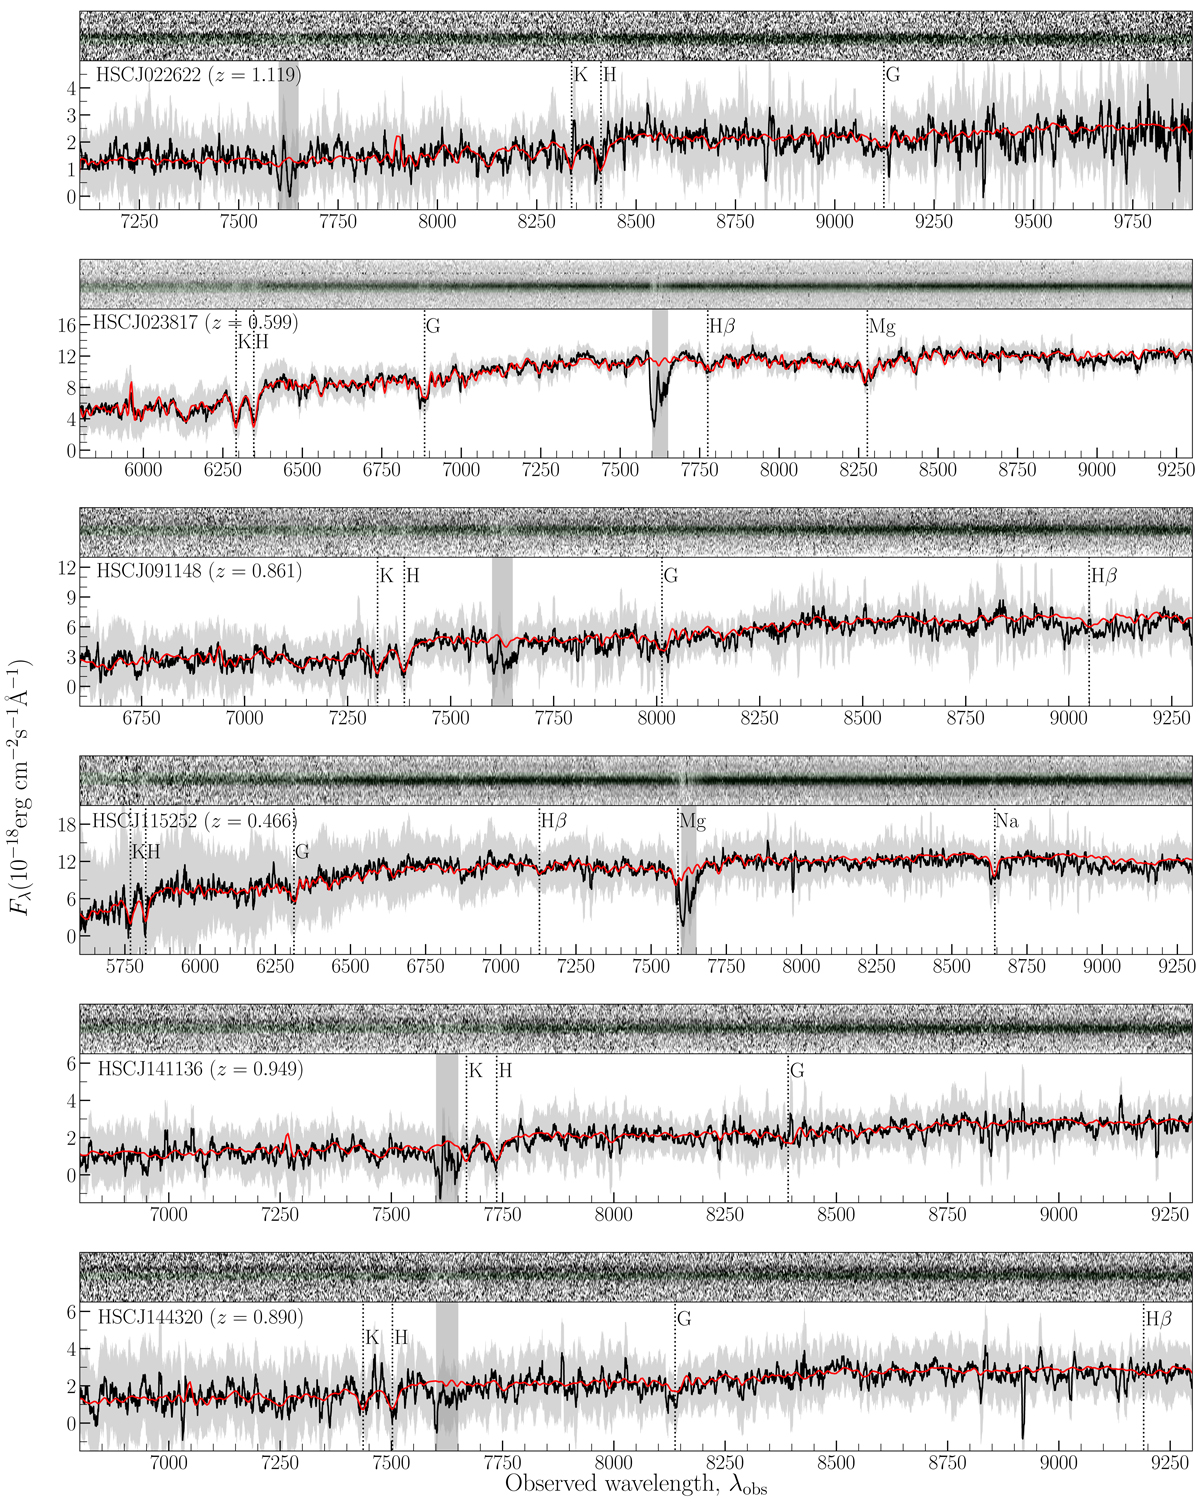
Stacked 1D spectra of the X-shooter lens galaxies (black lines) with commonly found absorption features indicated (vertical dashed lines). The error on the spectrum is shown with a shaded region (gray). Upper panel in each row: small cutouts of the 2D spectrum with a green shaded region corresponding to the aperture for 1D spectra extraction of the lens galaxy. The vertical rectangular shaded region (gray) shown in all panels indicates absorption features probably due to telluric contamination. The lens redshift is shown in the upper-left corner of each panel. For comparison, we show a composite luminous red galaxy spectrum from Dobos et al. (2012) shifted by the measured redshifts, in red. The unit of the wavelength is angstroms.
Current usage metrics show cumulative count of Article Views (full-text article views including HTML views, PDF and ePub downloads, according to the available data) and Abstracts Views on Vision4Press platform.
Data correspond to usage on the plateform after 2015. The current usage metrics is available 48-96 hours after online publication and is updated daily on week days.
Initial download of the metrics may take a while.