Fig. 1.
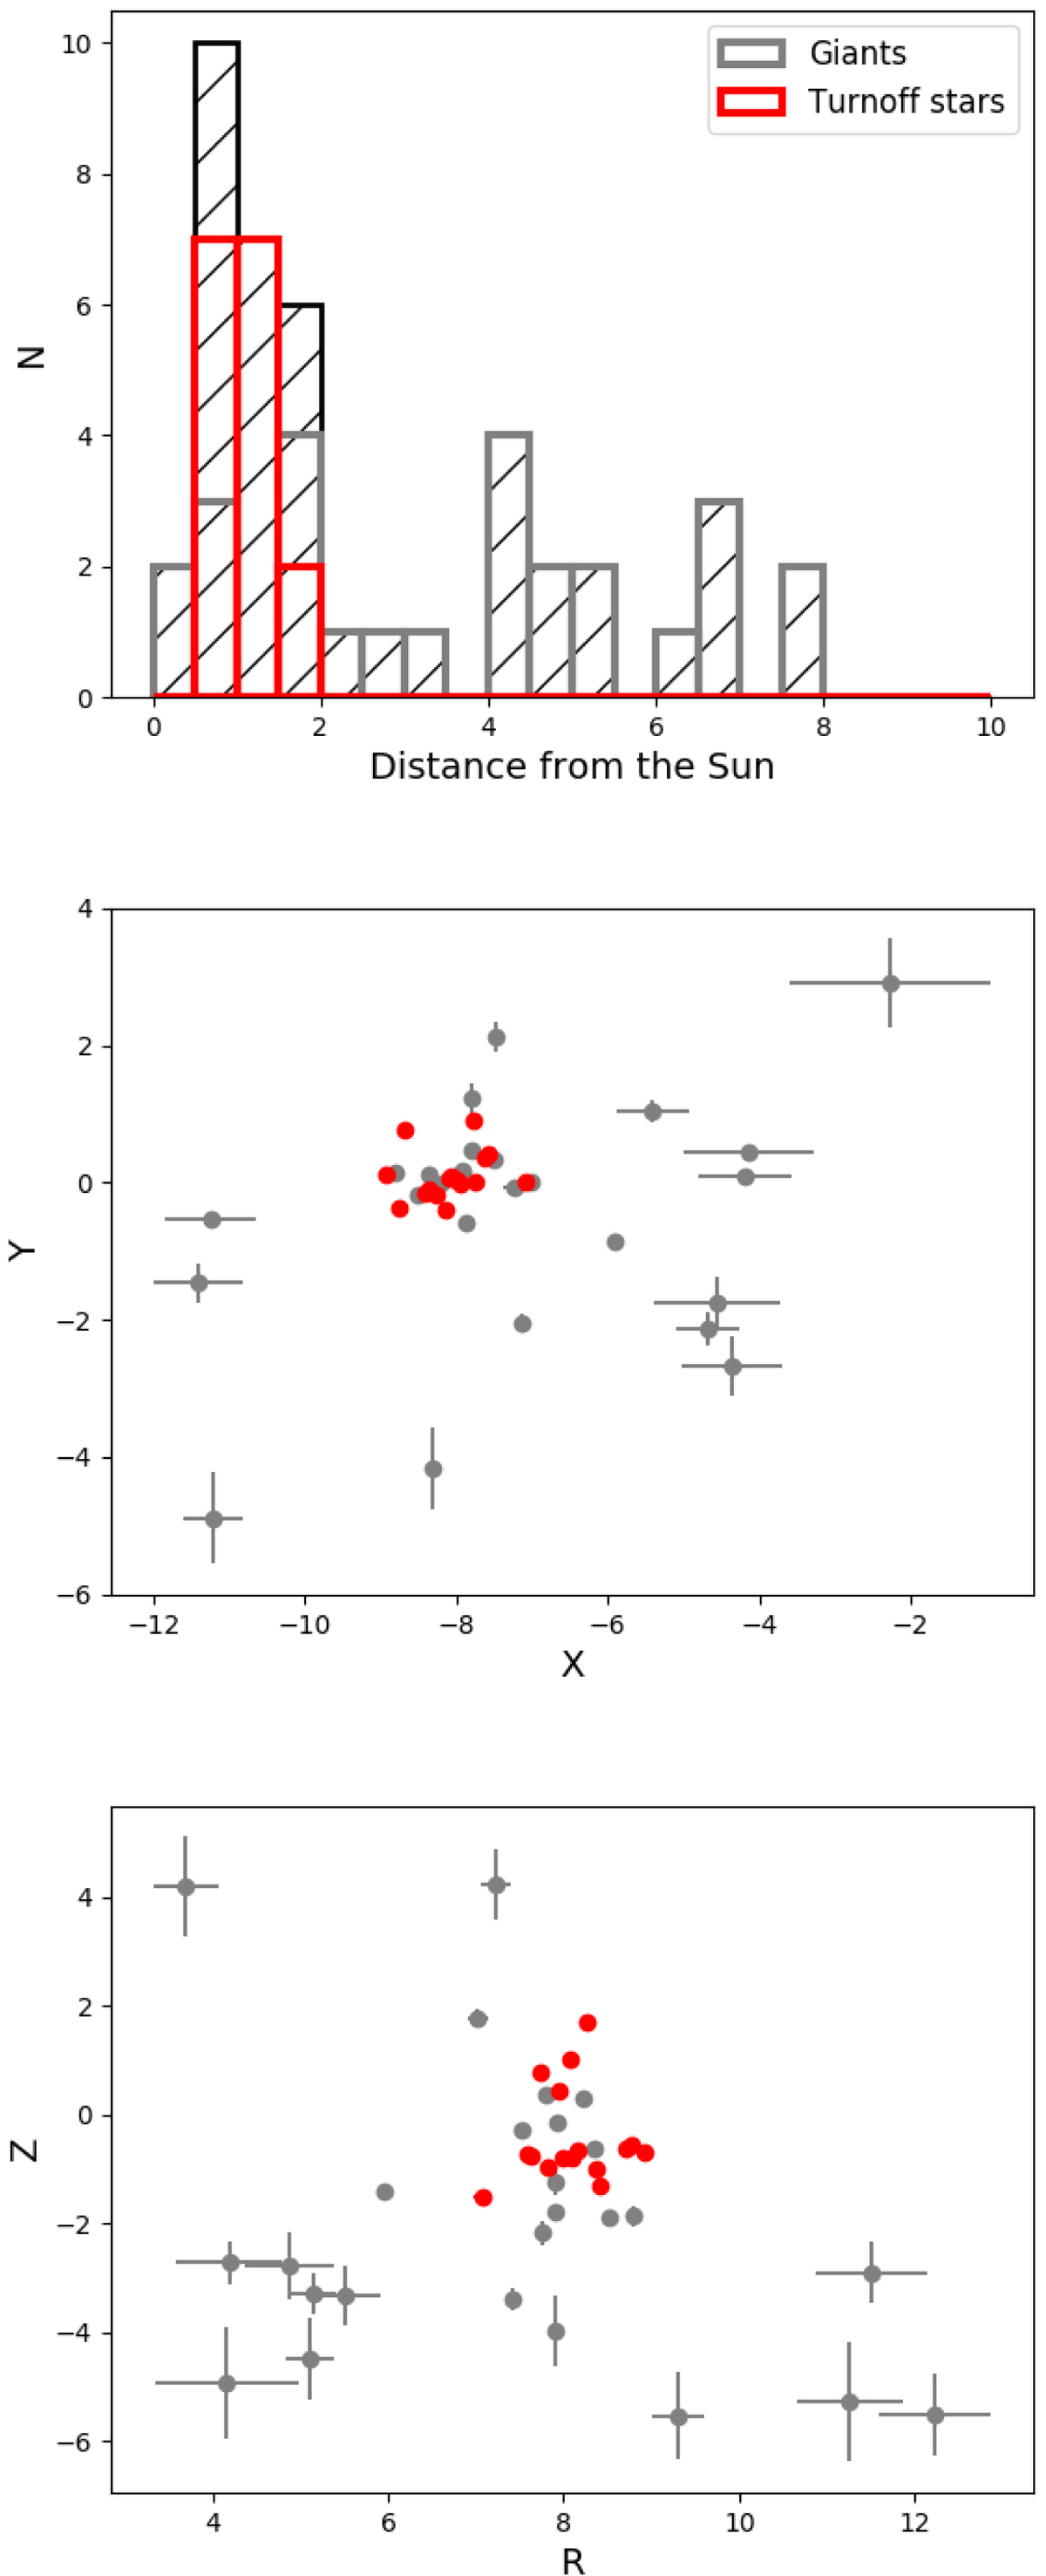
Top panel: histogram (hatched black) of the distances (in kpc) to the Sun, of the sample of stars studied in the frame of the ESO LP First Stars. The grey histogram shows the distance distribution of giant stars, the red histogram that of turnoff stars; middle panel: X − Y spatial distribution of stars in the sample (grey dots for giants, red dots for turnoff stars), and their uncertainties; bottom panel: R − Z spatial distribution of stars in the sample (grey dots for giants, red dots for turnoff stars) and their uncertainties.
Current usage metrics show cumulative count of Article Views (full-text article views including HTML views, PDF and ePub downloads, according to the available data) and Abstracts Views on Vision4Press platform.
Data correspond to usage on the plateform after 2015. The current usage metrics is available 48-96 hours after online publication and is updated daily on week days.
Initial download of the metrics may take a while.