Fig. 6.
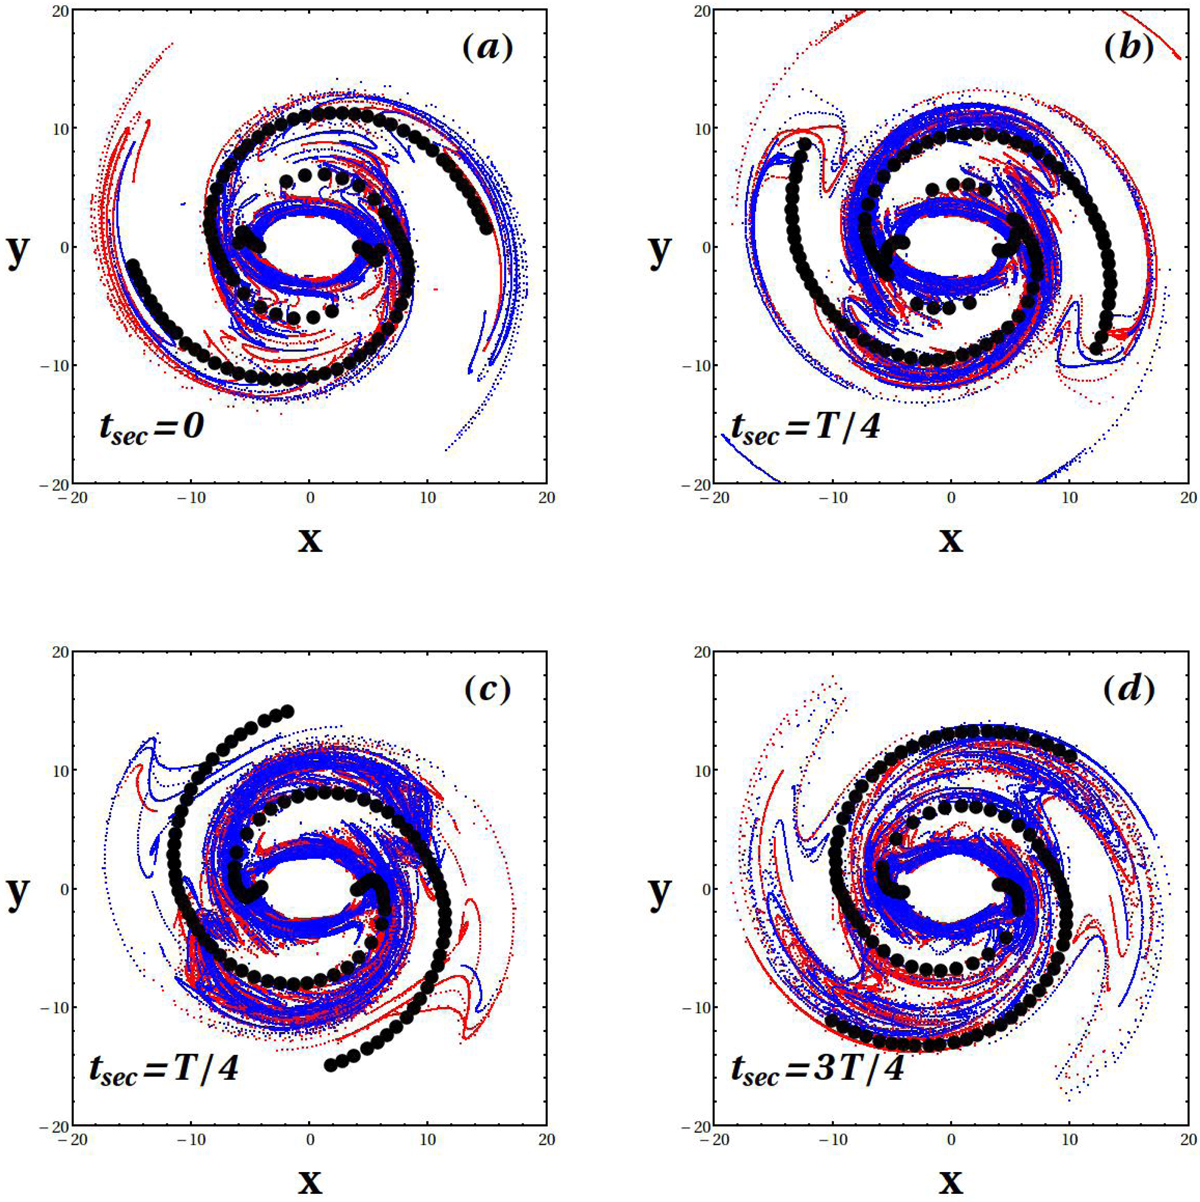
“Double section” apocentric manifolds ![]() (blue) and
(blue) and ![]() (red) are plotted at four different times ts as indicated in each panel. The black-dotted curves mark the local maxima of the surface density σ(ρ, ϕ, t), corresponding to the potential V = Vd(ρ)+Vb(ρ, ϕ)+Vsp(ρ, ϕ, t) at the times t = ts. These maxima are plotted in the domain 6 kpc < ρ < 15 Kpc, where the imposed spirals have a significant amplitude.
(red) are plotted at four different times ts as indicated in each panel. The black-dotted curves mark the local maxima of the surface density σ(ρ, ϕ, t), corresponding to the potential V = Vd(ρ)+Vb(ρ, ϕ)+Vsp(ρ, ϕ, t) at the times t = ts. These maxima are plotted in the domain 6 kpc < ρ < 15 Kpc, where the imposed spirals have a significant amplitude.
Current usage metrics show cumulative count of Article Views (full-text article views including HTML views, PDF and ePub downloads, according to the available data) and Abstracts Views on Vision4Press platform.
Data correspond to usage on the plateform after 2015. The current usage metrics is available 48-96 hours after online publication and is updated daily on week days.
Initial download of the metrics may take a while.