Fig. 2.
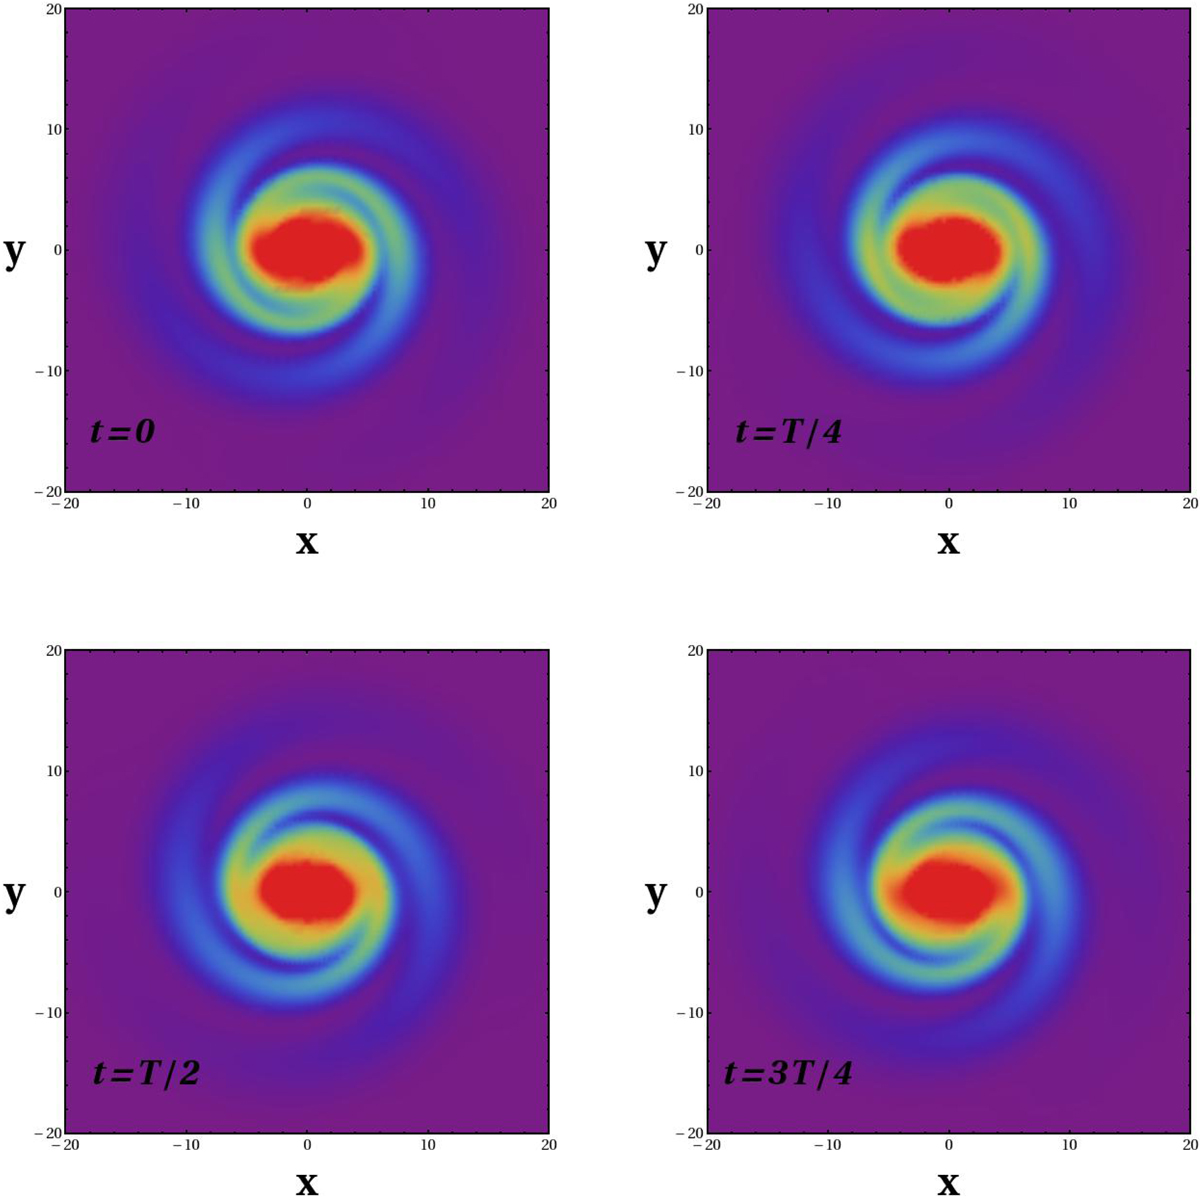
Color map of the surface density Σ(ρ, ϕ) corresponding to the potential V = Vd + Vb + Vsp (see text), as viewed in the bar’s rotating frame, at four different snapshots, namely t = 0 (top left), t = T/4 (top right), t = T/2 (bottom left), and t = 3T/4 (bottom right), where T = π/|Ωsp − Ωbar|. Since Ωsp < Ωbar, the spirals have a relative clockwise angular displacement in time with respect to the bar. However, the morphological continuity between the bar and spirals is retained in all of these snapshots.
Current usage metrics show cumulative count of Article Views (full-text article views including HTML views, PDF and ePub downloads, according to the available data) and Abstracts Views on Vision4Press platform.
Data correspond to usage on the plateform after 2015. The current usage metrics is available 48-96 hours after online publication and is updated daily on week days.
Initial download of the metrics may take a while.