Free Access
Fig. 9.
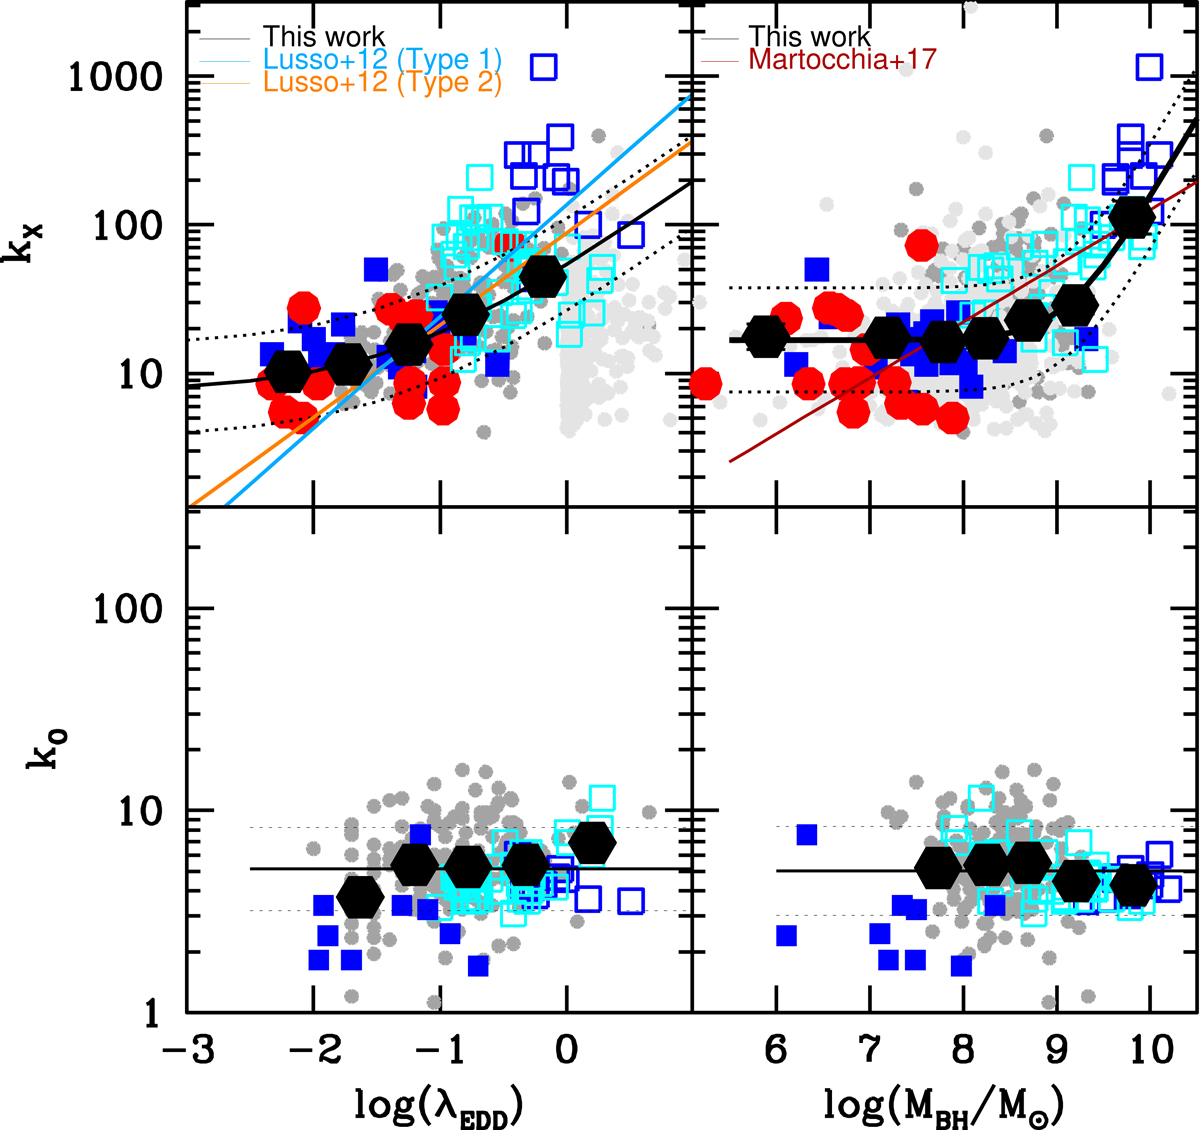
Upper panels: hard X-ray bolometric correction as a function of the Eddington ratio (left) and of the BH mass (right). Lower panels: optical bolometric correction as a function of the Eddington ratio (left) and of the BH mass (right). Black solid lines show our best-fit relations. Symbols are the same as in Fig. 6.
Current usage metrics show cumulative count of Article Views (full-text article views including HTML views, PDF and ePub downloads, according to the available data) and Abstracts Views on Vision4Press platform.
Data correspond to usage on the plateform after 2015. The current usage metrics is available 48-96 hours after online publication and is updated daily on week days.
Initial download of the metrics may take a while.