Fig. 8.
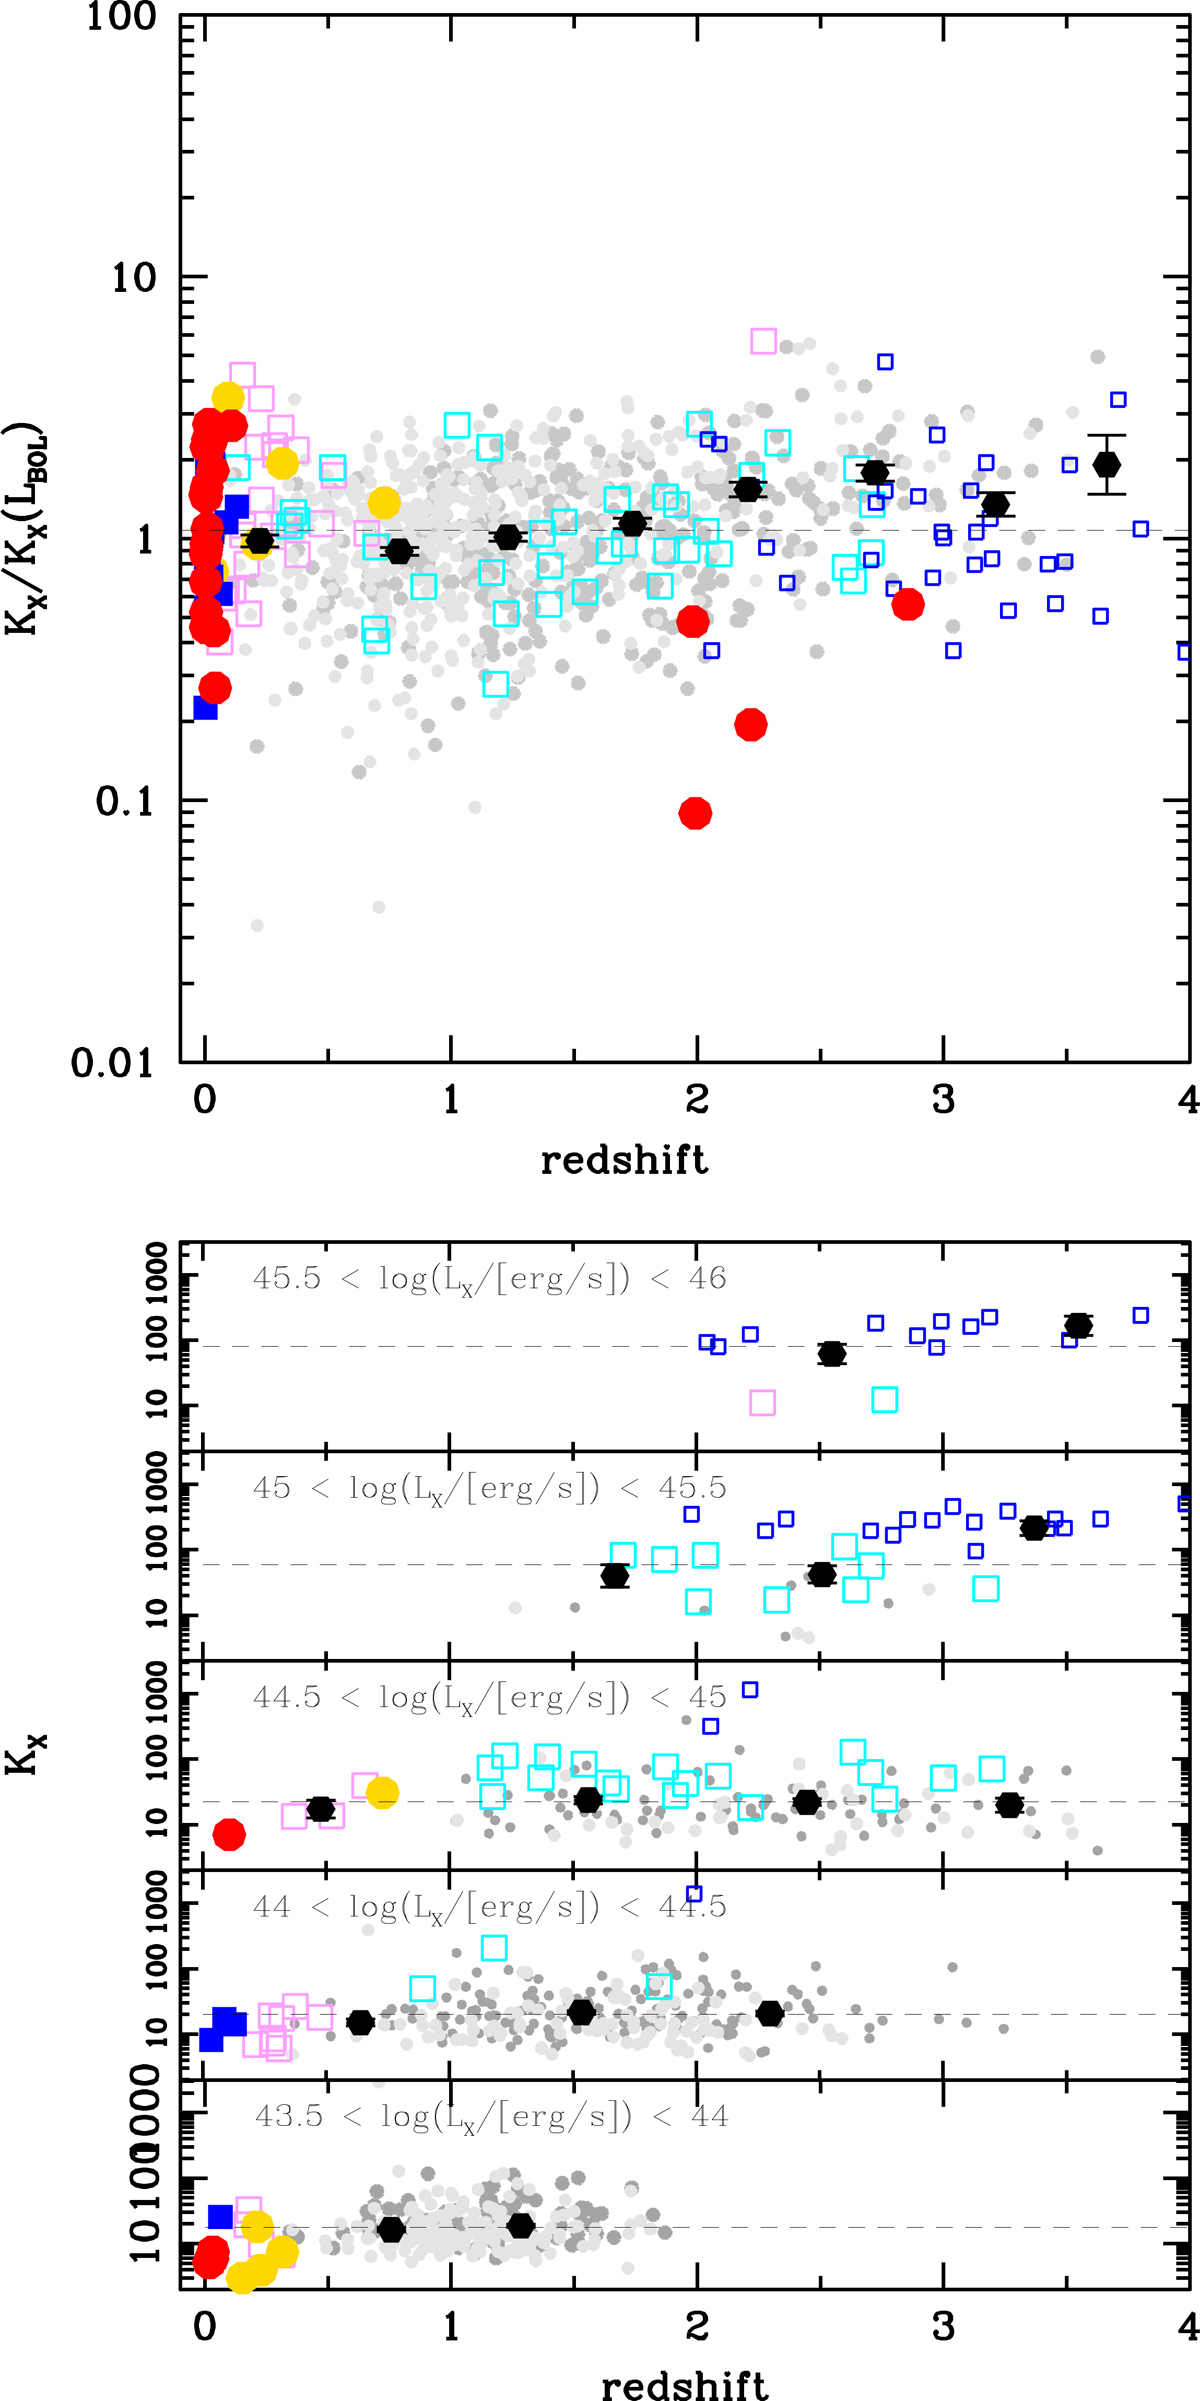
Hard X-ray bolometric correction as a function of redshift. In the top panel, the normalized bolometric correction has been obtained by dividing KX for the corresponding bolometric correction given by Eq. (2). Bottom panel: KX as a function of redshift in five ranges of hard X-ray luminosity. Black hexagons are the average values of KX computed in bins of redshift and the dashed line is the average KX of the whole sample within the entire redshift range. Symbols are the same as in Fig. 6.
Current usage metrics show cumulative count of Article Views (full-text article views including HTML views, PDF and ePub downloads, according to the available data) and Abstracts Views on Vision4Press platform.
Data correspond to usage on the plateform after 2015. The current usage metrics is available 48-96 hours after online publication and is updated daily on week days.
Initial download of the metrics may take a while.