Fig. 6.
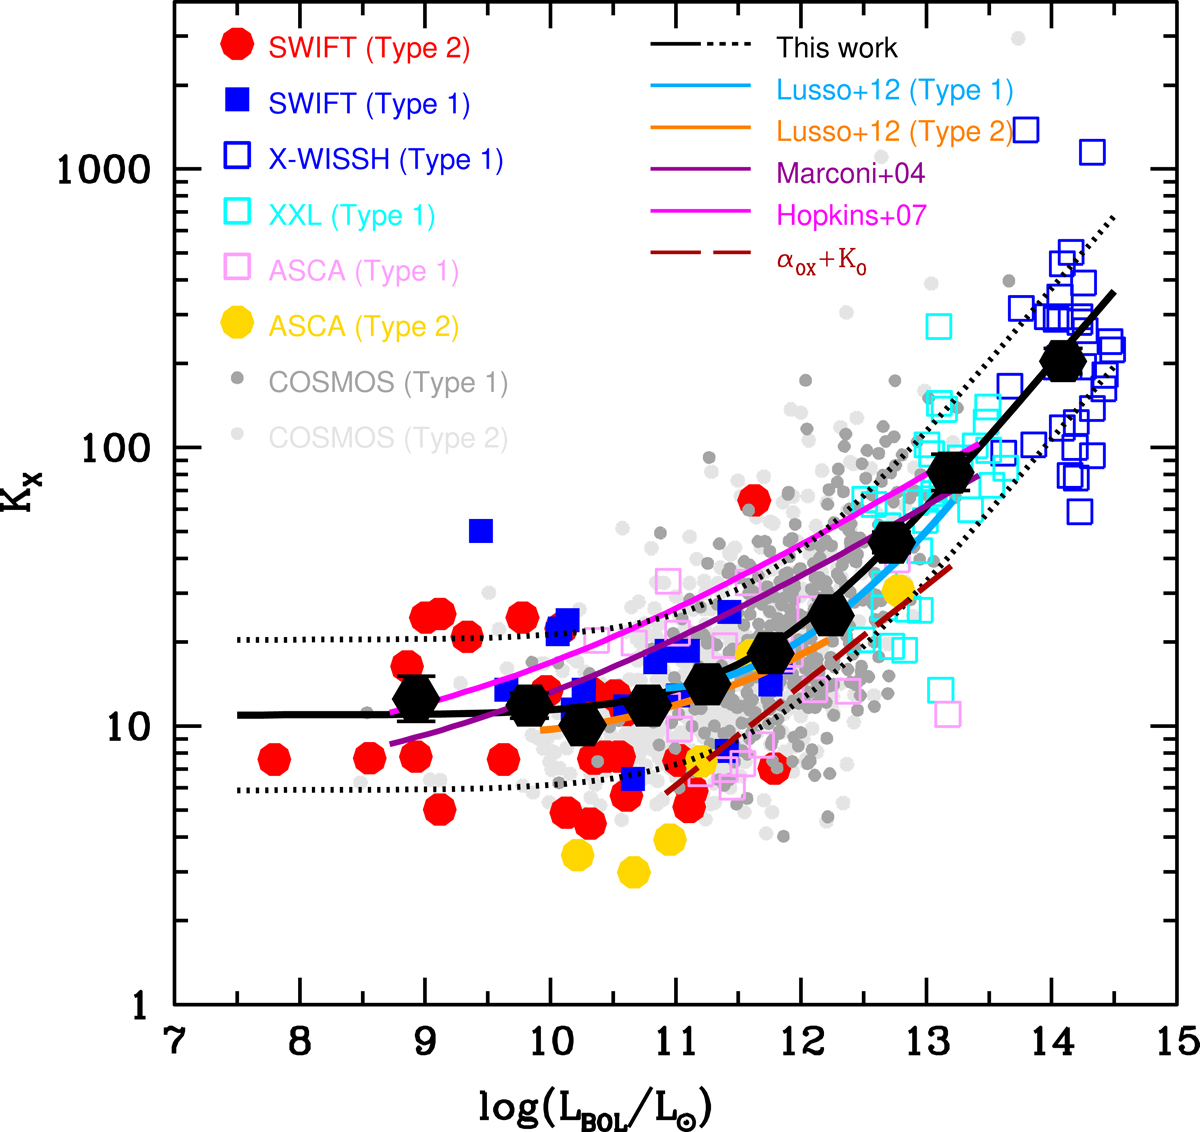
General hard X-ray bolometric correction in the 2–10 keV band as a function of the bolometric correction for type 1 and type 2 AGN. Symbols are the same as in Fig. 4. Black hexagons are the average bolometric correction values, in bins of bolometric luminosity. The black solid line is our best-fit solution; the brown solid line is the analytical prediction obtained by assuming the relation between the X-ray luminosity and the optical luminosity by Lusso & Risaliti (2016) and the optical bolometric correction by L12. See text and Table 1 for details.
Current usage metrics show cumulative count of Article Views (full-text article views including HTML views, PDF and ePub downloads, according to the available data) and Abstracts Views on Vision4Press platform.
Data correspond to usage on the plateform after 2015. The current usage metrics is available 48-96 hours after online publication and is updated daily on week days.
Initial download of the metrics may take a while.