Fig. 4.
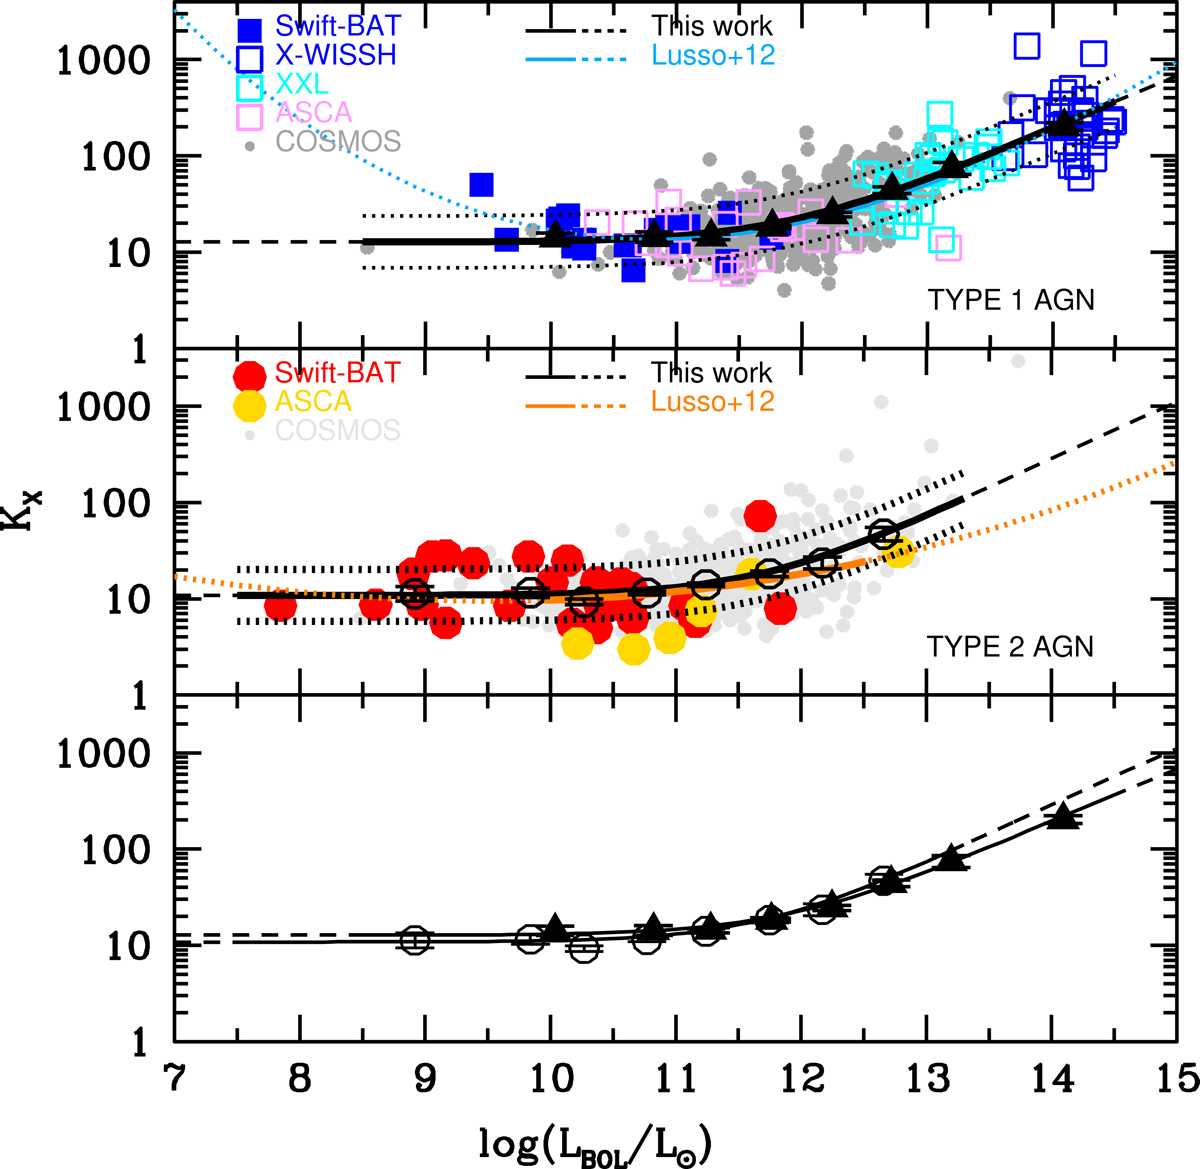
Hard X-ray bolometric correction in the 2–10 keV band as a function of the bolometric luminosity for type 1 (upper panel) and type 2 (central panel) AGN. Symbols are as in the legend. Black filled triangles and open circles show the average values for type 1 and type 2 sources, respectively (directly compared in the lower panel), in bins of bolometric luminosity. The black solid and dashed lines show our best-fit relations and their extrapolations according to Eq. (2).
Current usage metrics show cumulative count of Article Views (full-text article views including HTML views, PDF and ePub downloads, according to the available data) and Abstracts Views on Vision4Press platform.
Data correspond to usage on the plateform after 2015. The current usage metrics is available 48-96 hours after online publication and is updated daily on week days.
Initial download of the metrics may take a while.