Fig. 3.
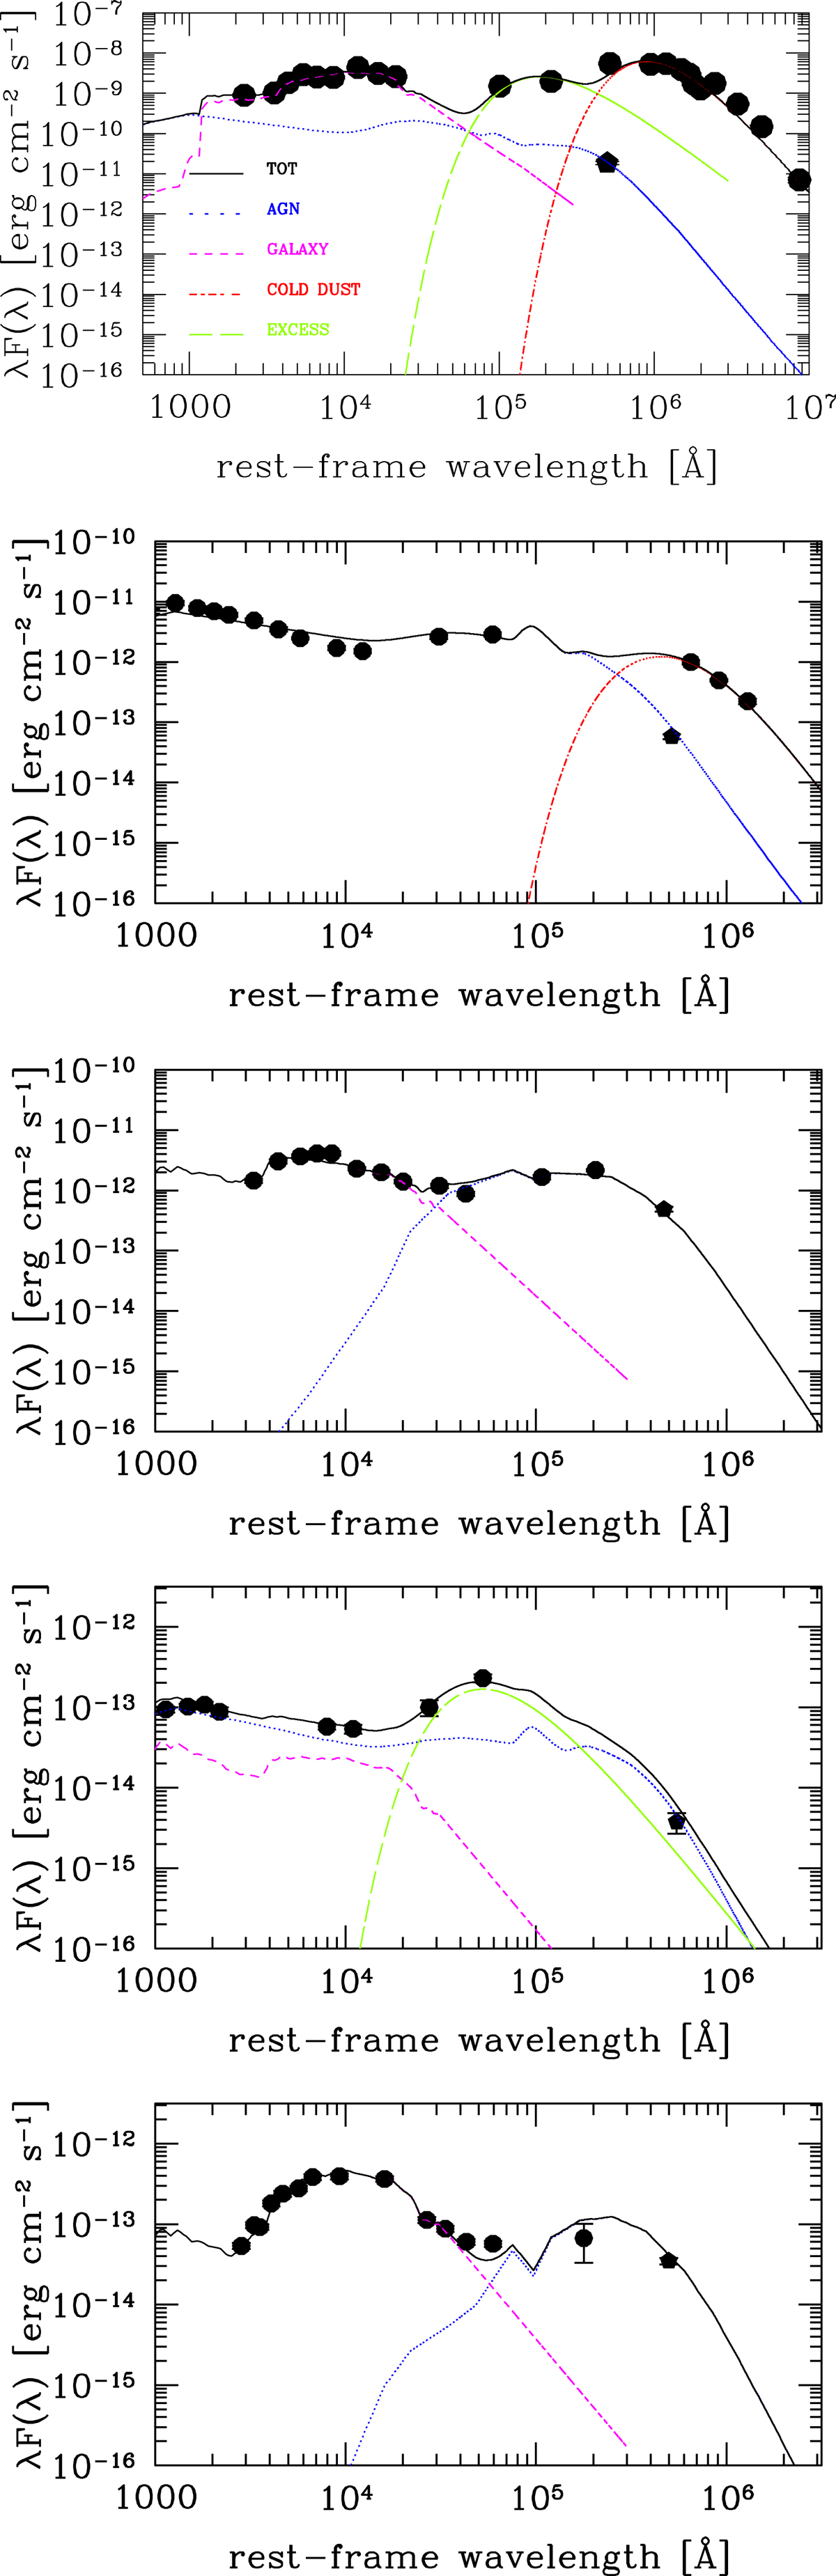
Example of SED fitting results. From top to bottom: one type 2 source from the Swift sample, one type 1 from the X-WISSH sample, one type 2 from the ASCA sample, one type 1 from the XXL sample and one type 2 from the COSMOS sample. The AGN, galaxy, cold dust and excess emission components are shown in different colors and line types (as stated in the legend of the first figure in the top panel). Black circles are the photometric points of the source. The virtual AGN pivotal photometric point at 50 μm, derived from the hard X-ray data, is shown as the black pentagon (see text for details).
Current usage metrics show cumulative count of Article Views (full-text article views including HTML views, PDF and ePub downloads, according to the available data) and Abstracts Views on Vision4Press platform.
Data correspond to usage on the plateform after 2015. The current usage metrics is available 48-96 hours after online publication and is updated daily on week days.
Initial download of the metrics may take a while.