Free Access
Fig. 10
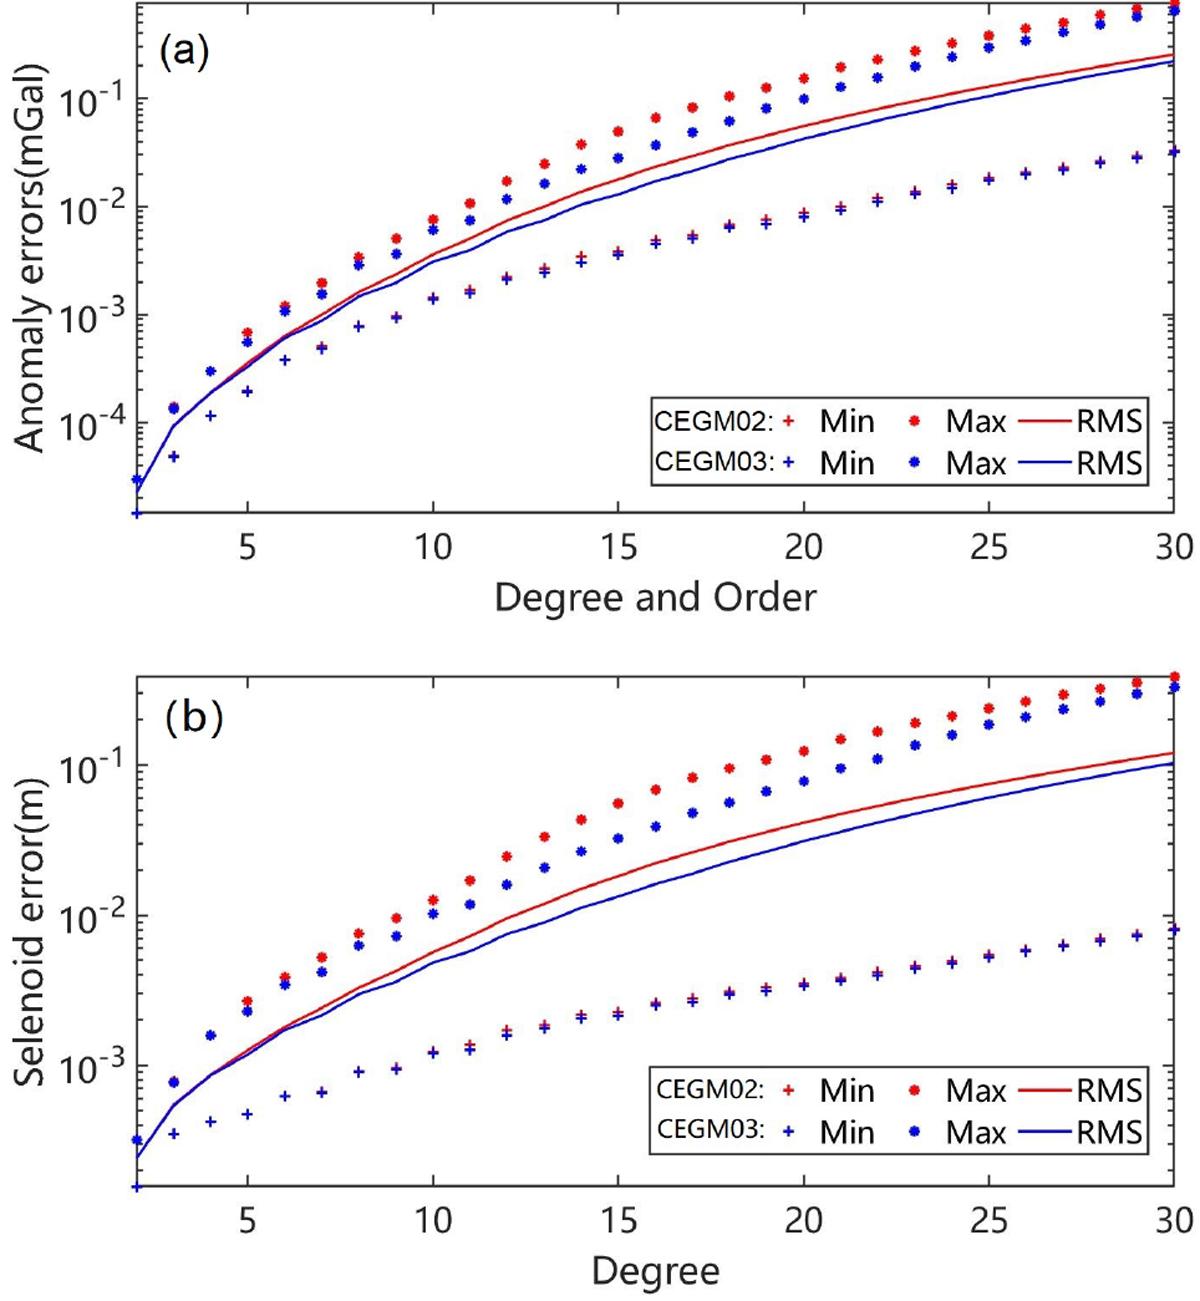
Gravity anomaly error (a) and selenoid error (b) from 2 to 30 degree and orders. Solid lines: the RMS of global anomaly error or selenoid error; plus signs: minimum value of global anomaly error or selenoid error; stars: maximum value of global anomaly error or selenoid error.
Current usage metrics show cumulative count of Article Views (full-text article views including HTML views, PDF and ePub downloads, according to the available data) and Abstracts Views on Vision4Press platform.
Data correspond to usage on the plateform after 2015. The current usage metrics is available 48-96 hours after online publication and is updated daily on week days.
Initial download of the metrics may take a while.