Fig. 9.
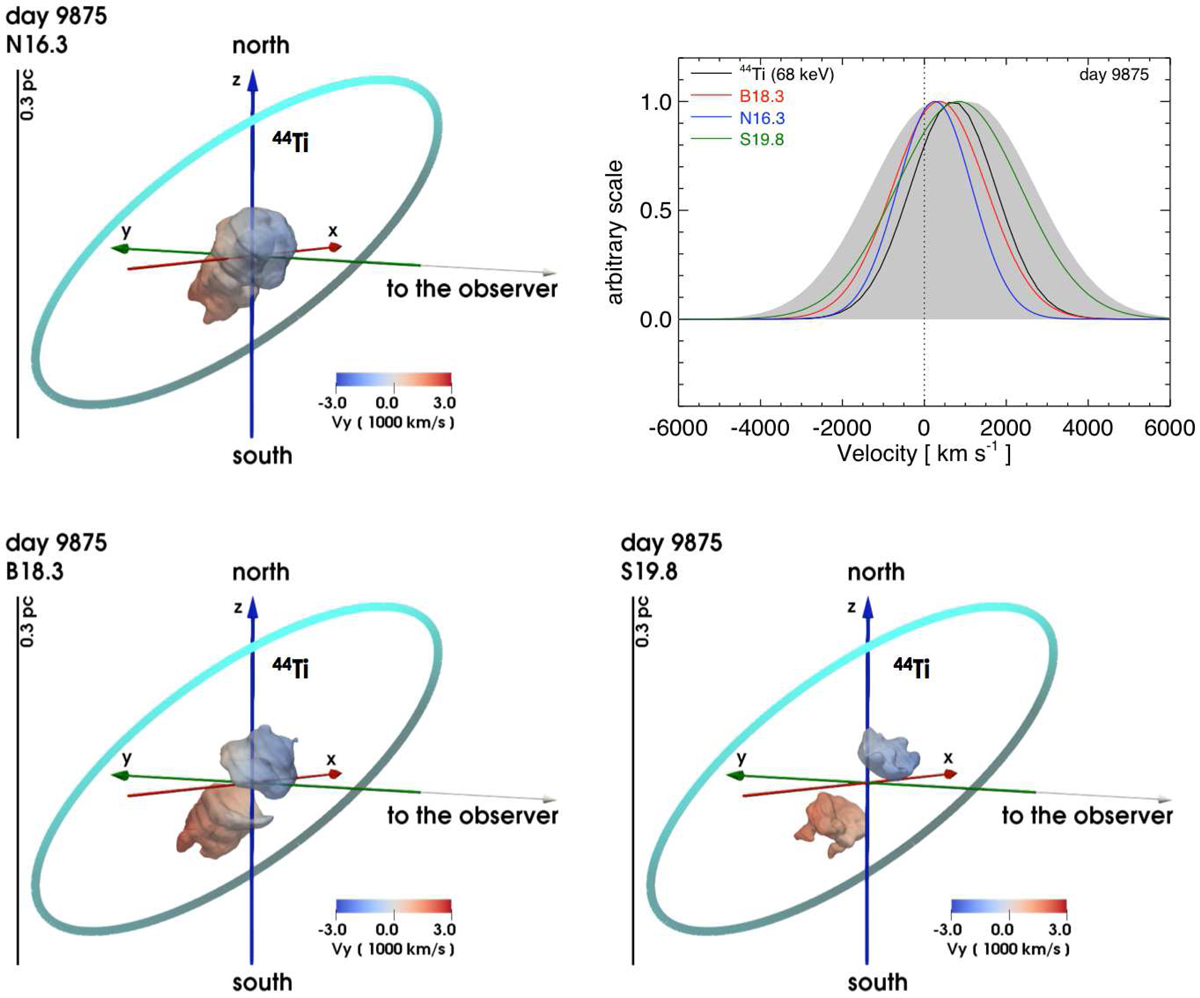
Isosurfaces of the titanium distribution for models N16.3 (upper left), B18.3 (lower left), and S19.8 (lower right) at day 9875. The semi-transparent isosurface corresponds to a value of the titanium density which is at 10% of the peak (maximum titanium density is 8.6 × 10⁻²² g cm−3 for N16.3, 6.9 × 10⁻²² g cm−3 for B18.3, and 2.3 × 10⁻²¹ g cm−3 for S19.8). The colors give the velocity along the LoS in units of 1000 km s−1 on the isosurface; the color coding is defined at the bottom of each panel. The ring indicates the position of the dense inner ring. The yardstick on the left indicates the length scale. Upper right panel: best-fit Gaussian for the 44Ti lines observed between 2012 and 2014 (black line; Boggs et al. 2015) and lines profile synthesized from models N16.3 (blue line), B18.3 (red line), and S19.8 (green line) at day 9875. The shaded region represents the 90% confidence area for the position of the peak and for the width of the Gaussian. See online Movie 5 for an animation of these data; a navigable 3D graphic of the titanium distribution for the three models is available at https://skfb.ly/6P7sI.
Current usage metrics show cumulative count of Article Views (full-text article views including HTML views, PDF and ePub downloads, according to the available data) and Abstracts Views on Vision4Press platform.
Data correspond to usage on the plateform after 2015. The current usage metrics is available 48-96 hours after online publication and is updated daily on week days.
Initial download of the metrics may take a while.